ngxtopは、NginxWebサーバー用の無料のオープンソースの柔軟なリアルタイム監視ツールです。 Nginxアクセスログを解析し、リクエスト数、リクエストされたURI、ステータスコードごとのリクエスト数などに関する情報を出力できます。これは、NginxWebサーバーに送信されるリクエストを監視するためのシンプルで使いやすいツールです。
この記事では、Ubuntu20.04にngxtop監視ツールをインストールして使用する方法を紹介します。
- Ubuntu20.04を実行しているサーバー。
- ルートパスワードはサーバーで構成されています。
ngxtopをインストール
ngxtopはPythonベースのツールであるため、PythonおよびPIPパッケージをシステムにインストールする必要があります。次のコマンドを使用して、Nginxでそれらをインストールできます:
apt-get install nginx python3 python3-pip -y
インストールすると、以下に示すように、PIPを使用してngxtopパッケージをインストールできます。
pip3 install ngxtop
ngxtopをインストールしたら、次のコマンドを使用してngxtopのバージョンを確認できます。
ngxtop --version
次の出力が得られるはずです:
xstat 0.1
ngxtopの使用方法
このセクションでは、ngxtopを使用してNginxWebサーバーを監視する方法を示します。
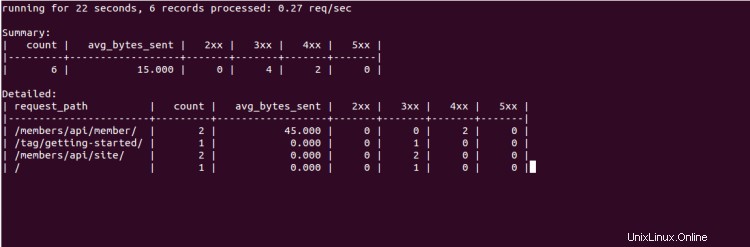
引数なしでngxtopコマンドを実行すると、リクエスト数、リクエストされたURI、ステータスコードごとのリクエスト数の概要が表示されます。
ngxtop
次の画面が表示されます。

-lオプションを使用して、分析するアクセスログを指定できます。
ngxtop -l /var/log/nginx/access.log
次の画面が表示されます。

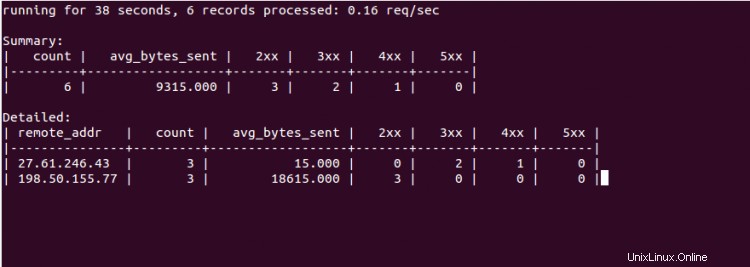
Nginxサーバーにアクセスしている上位のIPを一覧表示するには、次のコマンドを実行します。
ngxtop --group-by remote_addr -l /var/log/nginx/access.log
次の画面が表示されます。
次のコマンドを使用して、送信された合計バイト数が最も多い10個のリクエストを出力できます。
ngxtop --order-by 'avg(bytes_sent) * count' -l /var/log/nginx/access.log
次の画面が表示されます。
ngxtopを使用すると、リモートサーバーからApacheログファイルを解析することもできます。次のコマンドで実行できます:
ssh [email protected] tail -f /var/log/apache2/access.log | ngxtop -f common
ngxtopで使用可能なすべてのオプションのリストを取得するには、次のコマンドを実行します。
ngxtop --help
次の出力が表示されます。
ngxtop - ad-hoc query for nginx access log.

Usage:
    ngxtop [options]
    ngxtop [options] (print|top|avg|sum)  ...
    ngxtop info
    ngxtop [options] query  ...

Options:
    -l , --access-log   access log file to parse.
    -f , --log-format   log format as specify in log_format directive. [default: combined]
    --no-follow  ngxtop default behavior is to ignore current lines in log
                     and only watch for new lines as they are written to the access log.
                     Use this flag to tell ngxtop to process the current content of the access log instead.
    -t , --interval   report interval when running in follow mode [default: 2.0]

    -g , --group-by   group by variable [default: request_path]
    -w , --having   having clause [default: 1]
    -o , --order-by   order of output for default query [default: count]
    -n , --limit   limit the number of records included in report for top command [default: 10]
    -a  ..., --a  ...  add exp (must be aggregation exp: sum, avg, min, max, etc.) into output

    -v, --verbose  more verbose output
    -d, --debug  print every line and parsed record
    -h, --help  print this help message.
    --version  print version information.

    Advanced / experimental options:
    -c , --config   allow ngxtop to parse nginx config file for log format and location.
    -i , --filter   filter in, records satisfied given expression are processed.
    -p , --pre-filter  in-filter expression to check in pre-parsing phase.

Examples:
    All examples read nginx config file for access log location and format.
    If you want to specify the access log file and / or log format, use the -f and -a options.

    "top" like view of nginx requests
    $ ngxtop

    Top 10 requested path with status 404:
    $ ngxtop top request_path --filter 'status == 404'

    Top 10 requests with highest total bytes sent
    $ ngxtop --order-by 'avg(bytes_sent) * count'

    Top 10 remote address, e.g., who's hitting you the most
    $ ngxtop --group-by remote_addr

    Print requests with 4xx or 5xx status, together with status and http referer
    $ ngxtop -i 'status >= 400' print request status http_referer

    Average body bytes sent of 200 responses of requested path begin with 'foo':
    $ ngxtop avg bytes_sent --filter 'status == 200 and request_path.startswith("foo")'

    Analyze apache access log from remote machine using 'common' log format
    $ ssh remote tail -f /var/log/apache2/access.log | ngxtop -f common
上記のガイドでは、Ubuntu20.04にngxtopをインストールして使用する方法を学びました。コマンドラインインターフェイスからNginxログを簡単に監視できるようになったことを願っています。