systemd-analyze コマンドは、ブート操作のパフォーマンス統計を取得するために使用されます。このコマンドは、どのタイプの情報をどのように出力するかを決定する 1 つ以上のサブコマンドを取ります。プロセス管理とトラブルシューティングでは、blame が最も適切なサブコマンドです。これにより、起動時に実行されたすべての systemd ユニットのリストが、各ユニットの実行にかかった時間とともに出力されます。 systemd-analyze Blame を使用できます システムの起動を遅くするサービスやその他のユニットを特定します。
構文
systemd-analyze コマンドの構文は次のとおりです:
# systemd-analyze [options] [subcommand]
systemd-analyze コマンドを使用して、各サービスの開始にかかった時間に関する情報を確認できます。 systemd-analyze time は、システムの起動にかかった時間に関する全体的な情報を提供できます。これは、起動中にカーネル、initrd、およびユーザー空間にかかった時間を明確に示すコマンド出力です。
# systemd-analyze time
Startup finished in 1.267s (kernel) + 6.798s (initrd) + 1min 2.139s (userspace) = 1min 10.205s
各ユニットの開始にかかった時間を調べるには、systemd-analyze Blame を実行します。
# systemd-analyze blame
         24.728s dev-mapper-centosx2droot.device
         15.135s kdump.service
         14.670s plymouth-quit-wait.service
         14.210s firewalld.service
          9.835s accounts-daemon.service
          7.383s ModemManager.service
          7.259s libvirtd.service
          7.257s systemd-logind.service
          7.177s ksm.service
          7.081s gssproxy.service
          7.067s avahi-daemon.service
          7.062s rsyslog.service
          7.039s abrt-ccpp.service
各ユニットの所要時間に従って出力がソートされていることがわかるので、起動中にどのサービスがより多くの時間を費やしているかを簡単に見つけ出し、問題を分析するために深く掘り下げることができます。
特定のステップでは、ユニットのすべての依存関係が満たされるまで、ブートを続行できません。これらの重要なポイントでユニットを確認するには、systemd-analyze critical-chain を実行してください。
# systemd-analyze critical-chain
The time after the unit is active or started is printed after the "@" character.
The time the unit takes to start is printed after the "+" character.
graphical.target @1min 2.102s
└─multi-user.target @1min 2.102s
└─abrt-vmcore.service @1min 1.228s +872ms
└─kdump.service @46.090s +15.135s
└─remote-fs.target @46.086s
└─remote-fs-pre.target @46.083s
└─iscsi-shutdown.service @45.951s +99ms
└─network.target @45.944s
└─network.service @44.959s +975ms
└─NetworkManager.service @38.653s +689ms
└─firewalld.service @24.439s +14.210s
└─basic.target @23.850s
└─sockets.target @23.849s
└─cups.socket @23.847s
└─sysinit.target @23.618s
└─systemd-update-utmp.service @23.603s +13ms
└─auditd.service @22.959s +643ms
└─systemd-tmpfiles-setup.service @22.726s +230ms
└─rhel-import-state.service @22.431s +294ms
└─local-fs.target @22.428s
└─boot.mount @19.675s +2.126s
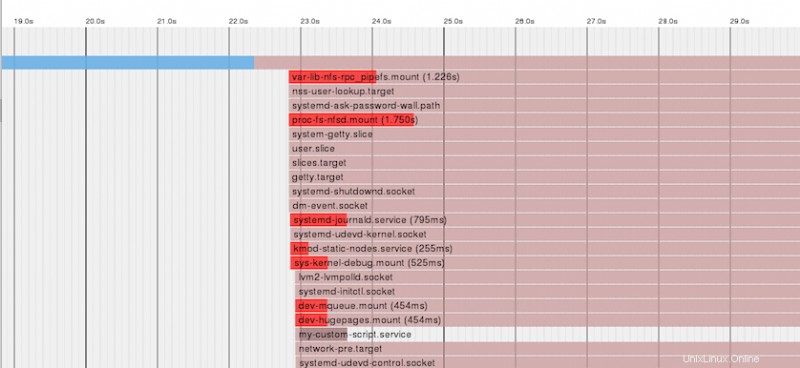
└─dev-disk-byx2duuid-7de2053cx2d44d7x2d4f33x2db522x2d81dee2f6b69b.device @19.652s SVG グラフィック イメージは、システム サービスの開始時間に関する詳細を含むプロットであり、初期化に費やされた時間を強調表示できます。プロットを表示するには、グラフィカル表示モードを有効にするか、x-windows を有効にしてください。
# systemd-analyze plot > plot.svg
# eog plot.svg
これは、CentOS 7 マシンでのサンプル プロットの抜粋です。拡大して滝をはっきりと確認してください。
systemd-analyze コマンドの例
1. 各ユニットの起動時間を一覧表示:
# systemd-analyze blame
2. タイム クリティカルなユニット チェーンのツリーを出力します。
# systemd-analyze critical-chain
3. 各システム サービスがいつ開始されたかを示す SVG ファイルを作成し、初期化に費やされた時間を強調表示します。
# systemd-analyze plot > path/to/file.svg
4. 依存関係グラフをプロットし、SVG ファイルに変換します:
# systemd-analyze dot | dot -Tsvg > path/to/file.svg
5. 実行中のユニットのセキュリティ スコアを表示:
# systemd-analyze security