Prometheusは、監視とアラートのために最初にSoundCloudで構築されたオープンソースのツールキットです。ツールキットはスタンドアロンのオープンソースプロジェクトになり、どの企業からも独立して維持されています。
ツールキットは、監視対象のターゲットでHTTPエンドポイントを廃棄することにより、監視対象のターゲットからメトリックを収集します。ほとんどのPrometheusコンポーネントはGoにあります。一部はJava、Python、Rubyで書かれています。
Prometheusは、任意の数値時系列を記録するのに適しています。これは、マシン中心の監視と高動的なサービス指向アーキテクチャーの監視の両方に適合します。 Prometheusは、実行と環境への統合を容易にするだけでなく、豊富なデータモデルとクエリ言語を提供します。
次のチュートリアルは、CentOSにPrometheusをインストールする手順を示しています。
CentOS7にPrometheusをインストールして構成する
ルートとしてターミナルにログインし、以下のコマンドの実行を開始します。
ステップ1-システムの更新
yum update -y
ステップ2–SELinuxを無効にする
SELinux構成を開き、ファイルを編集します:
vim /etc/sysconfig/selinux
「SELINUX=enforcing」を「SELINUX=disabled」に変更します。
ファイルを保存して終了します。次に、システムを再起動します。
reboot
ステップ3–Prometheusパッケージをダウンロード
Prometheusの公式ダウンロードページに移動し、Linuxの「tar」ファイルのURLをコピーします。
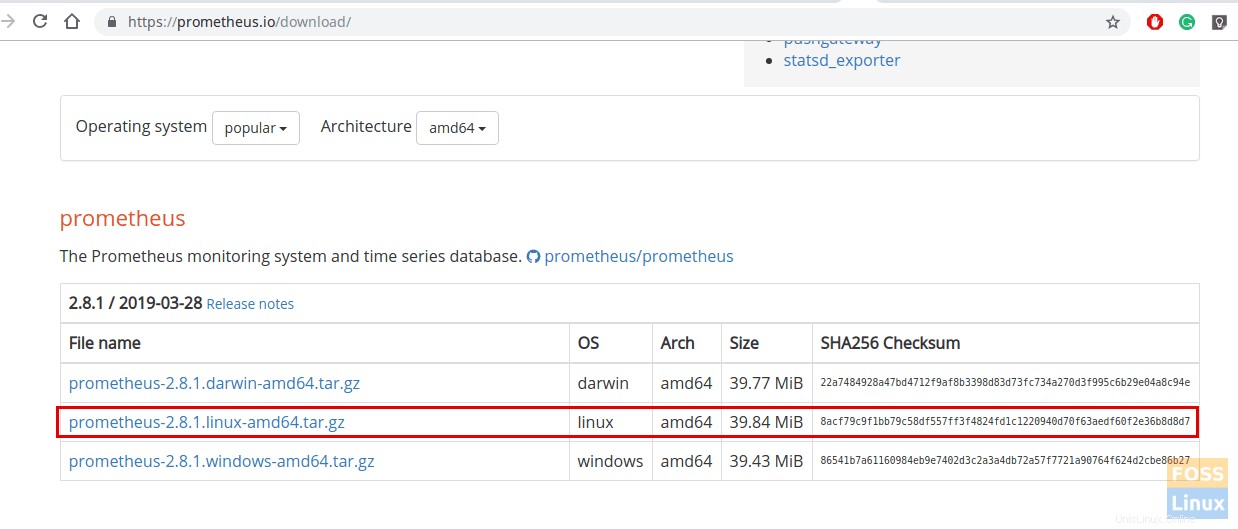
次のコマンドを実行して、パッケージをダウンロードします。以下のコマンドでwgetの後にコピーしたURLを貼り付けます:
wget https://github.com/prometheus/prometheus/releases/download/v2.8.1/prometheus-2.8.1.linux-amd64.tar.gz
ステップ4–Prometheusを構成する
Prometheusユーザーを追加します。
useradd --no-create-home --shell /bin/false prometheus
必要なディレクトリを作成します。
mkdir /etc/prometheus
mkdir /var/lib/prometheus
上記のディレクトリの所有者を変更します。
chown prometheus:prometheus /etc/prometheus
chown prometheus:prometheus /var/lib/prometheus
次に、Prometheusのダウンロード場所に移動し、解凍します。
tar -xvzf prometheus-2.8.1.linux-amd64.tar.gz
好みに応じて名前を変更します。
mv prometheus-2.8.1.linux-amd64 prometheuspackage
「prometheus」と「promtool」のバイナリを「prometheuspackage」フォルダから「/usr/ local/bin」にコピーします。
cp prometheuspackage/prometheus /usr/local/bin/
cp prometheuspackage/promtool /usr/local/bin/
所有権をPrometheusユーザーに変更します。
chown prometheus:prometheus /usr/local/bin/prometheus
chown prometheus:prometheus /usr/local/bin/promtool
「consoles」および「console_libraries」ディレクトリを「prometheuspackage」から「/etc/prometheusfolder」にコピーします
cp -r prometheuspackage/consoles /etc/prometheus
cp -r prometheuspackage/console_libraries /etc/prometheus
所有権をPrometheusユーザーに変更します
chown -R prometheus:prometheus /etc/prometheus/consoles
chown -R prometheus:prometheus /etc/prometheus/console_libraries
Prometheus構成ファイルを追加および変更します。
構成を「/etc/prometheus/prometheus.yml」に追加する必要があります
次に、prometheus.ymlファイルを作成します。
vim /etc/prometheus/prometheus.yml
次の構成をファイルに追加します。
global:
  scrape_interval: 10s

scrape_configs:
  - job_name: 'prometheus_master'
    scrape_interval: 5s
    static_configs:
      - targets: ['localhost:9090']
ファイルを保存して終了します
ファイルの所有権を変更します。
chown prometheus:prometheus /etc/prometheus/prometheus.yml
Prometheusサービスファイルを構成します。
vim /etc/systemd/system/prometheus.service
次のコンテンツをファイルにコピーします。
[Unit]
Description=Prometheus
Wants=network-online.target
After=network-online.target

[Service]
User=prometheus
Group=prometheus
Type=simple
ExecStart=/usr/local/bin/prometheus \
--config.file /etc/prometheus/prometheus.yml \
--storage.tsdb.path /var/lib/prometheus/ \
--web.console.templates=/etc/prometheus/consoles \
--web.console.libraries=/etc/prometheus/console_libraries

[Install]
WantedBy=multi-user.target
保存して終了ファイルを作成します。
systemdサービスをリロードします。
systemctl daemon-reload
Prometheusサービスを開始します。
systemctl start prometheus
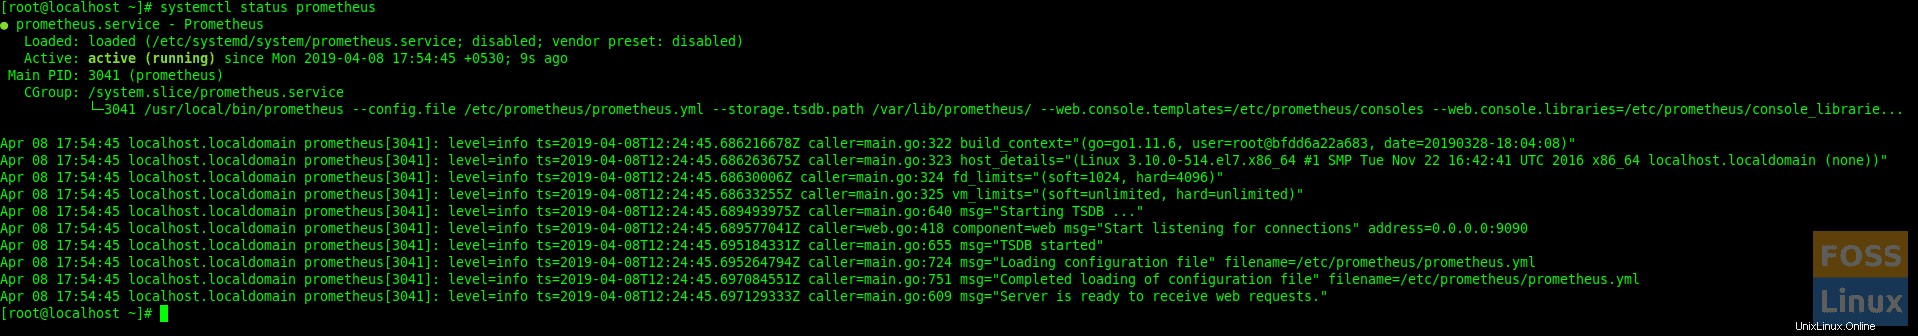
サービスステータスを確認してください。
systemctl status prometheus
ファイアウォールルールを追加します。
firewall-cmd --zone=public --add-port=9090/tcp --permanent
ファイアウォールサービスをリロードします。
systemctl reload firewalld
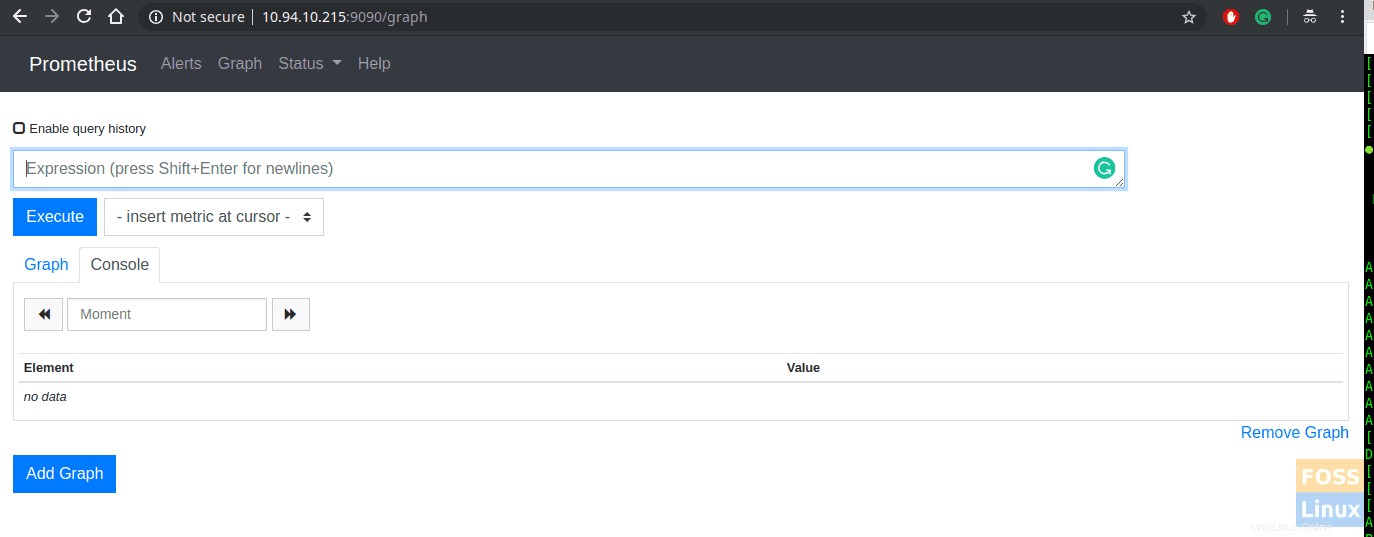
ステップ5–PrometheusWebインターフェイスにアクセスする
次のURLを使用してUIにアクセスします。
http://Server-IP:9090/graph
次に、次のインターフェイスが表示されます。
ステップ6–Prometheusを使用してLinuxサーバーを監視する
まず、LinuxサーバーでPrometheusノードエクスポーターを構成する必要があります。
NodeExporterのURLを公式ダウンロードページからコピーします。
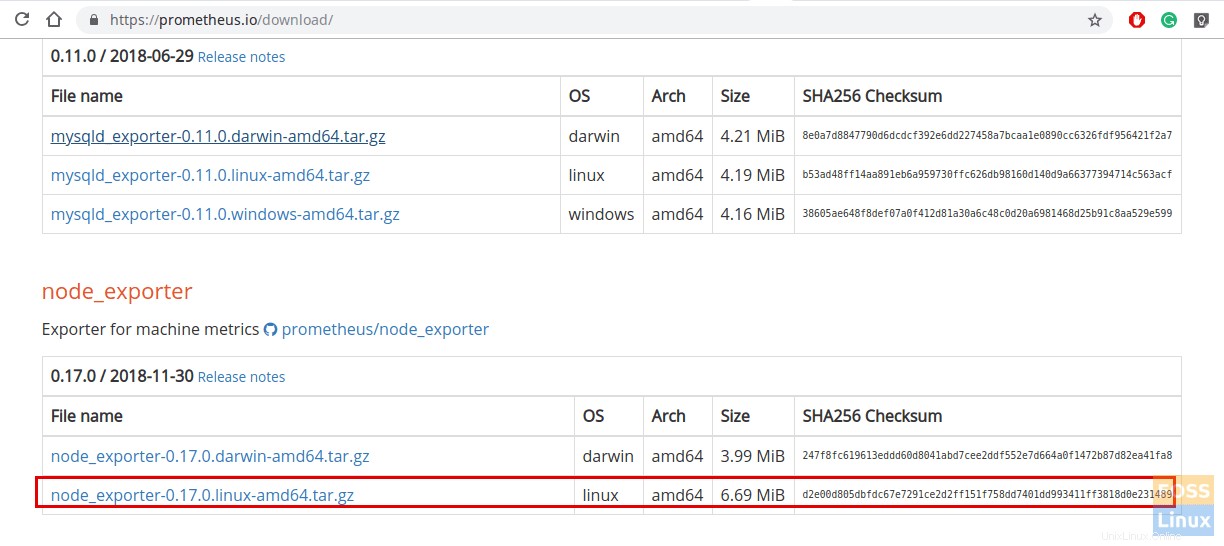
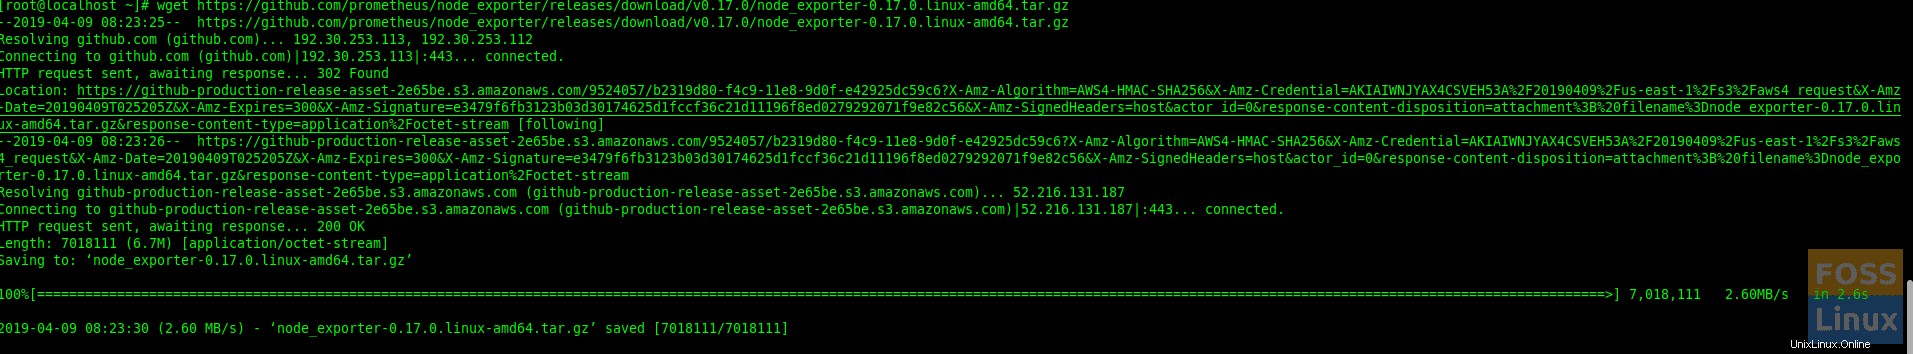
次のコマンドで、コピーしたURLをwgetの後に貼り付けます。
wget https://github.com/prometheus/node_exporter/releases/download/v0.17.0/node_exporter-0.17.0.linux-amd64.tar.gz
ダウンロードしたパッケージを解凍します。
tar -xvzf node_exporter-0.17.0.linux-amd64.tar.gz
ノードエクスポータのユーザーを作成します。
useradd -rs /bin/false nodeusr
ダウンロードした抽出パッケージからバイナリを「/usr/ local/bin」に移動します。
mv node_exporter-0.17.0.linux-amd64/node_exporter /usr/local/bin/
ノードエクスポータのサービスファイルを作成します。
vim /etc/systemd/system/node_exporter.service
次のコンテンツをファイルに追加します。
[Unit]
Description=Node Exporter
After=network.target

[Service]
User=nodeusr
Group=nodeusr
Type=simple
ExecStart=/usr/local/bin/node_exporter

[Install]
WantedBy=multi-user.target
ファイルを保存して終了します。
システムデーモンをリロードします。
systemctl daemon-reload
ノードエクスポータサービスを開始します。
systemctl start node_exporter
ノードエクスポータを許可するファイアウォールルールを追加します。
firewall-cmd --zone=public --add-port=9100/tcp --permanent
ファイアウォールサービスをリロードします。
systemctl restart firewalld
システム起動時にノードエクスポータを有効にします。
systemctl enable node_exporter
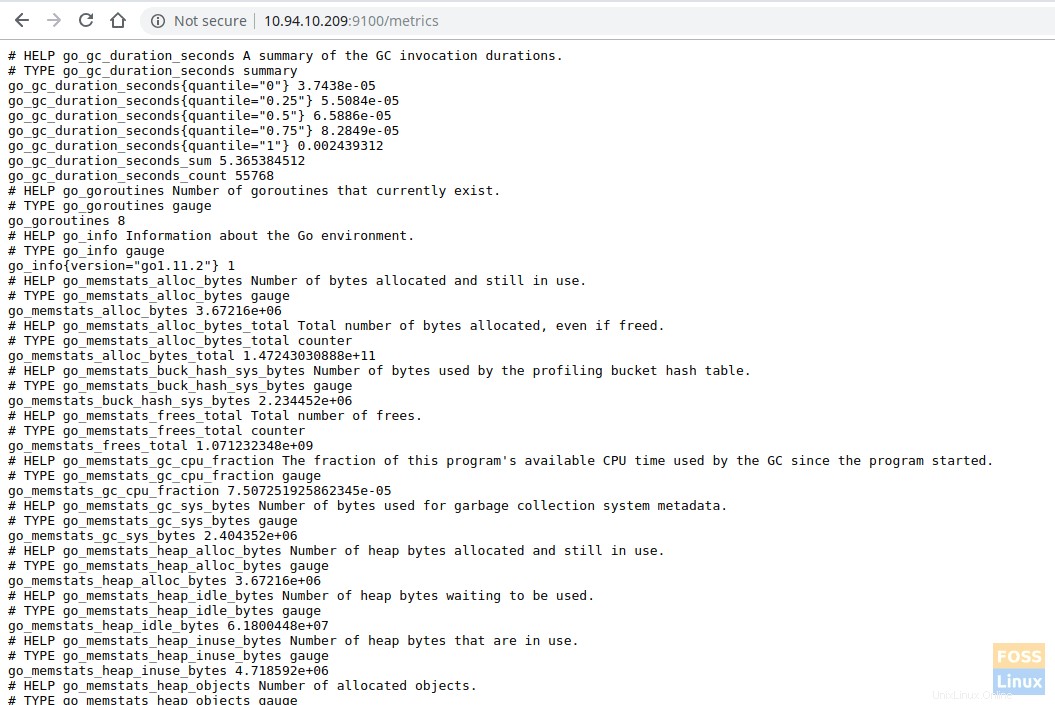
メトリックスブラウジングノードエクスポーターURLを表示します。
http://IP-Address:9100/metrics
Prometheusサーバーに構成済みノードエクスポーターターゲットを追加します。
Prometheusサーバーにログインし、prometheus.ymlファイルを変更します
ファイルを編集します:
vim /etc/prometheus/prometheus.yml
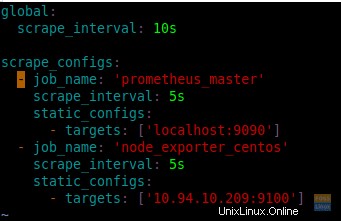
スクレイプ設定の下に次の設定を追加します。
 - job_name: 'node_exporter_centos'
    scrape_interval: 5s
    static_configs:
      - targets: ['10.94.10.209:9100']
ファイルは次のようになります。
Prometheusサービスを再起動します。
systemctl restart prometheus
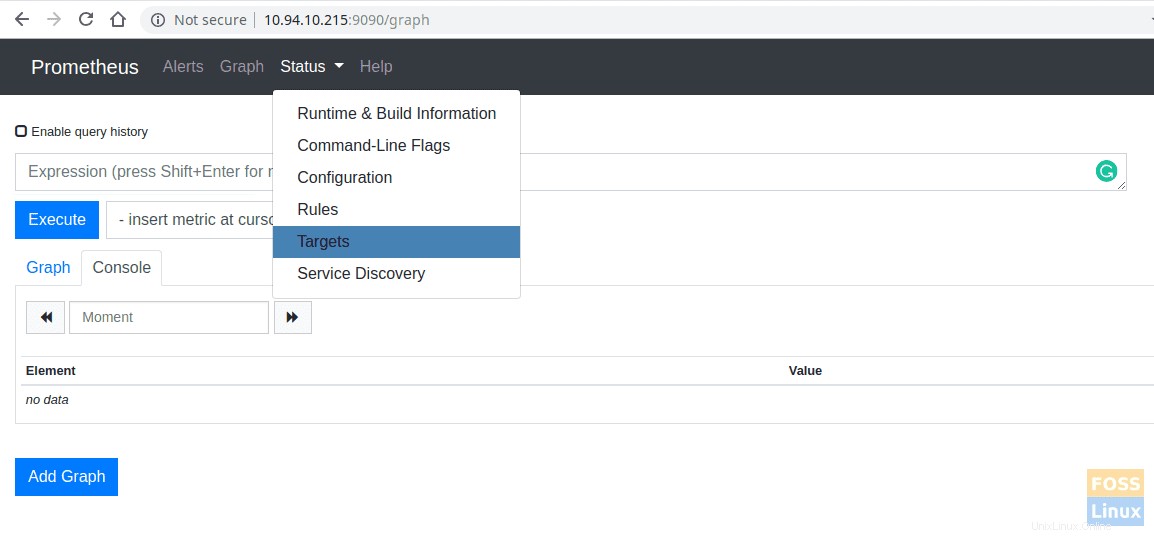
PrometheusサーバーのWebインターフェイスにログインし、ターゲットを確認します。
http://Prometheus-Server-IP:9090/targets
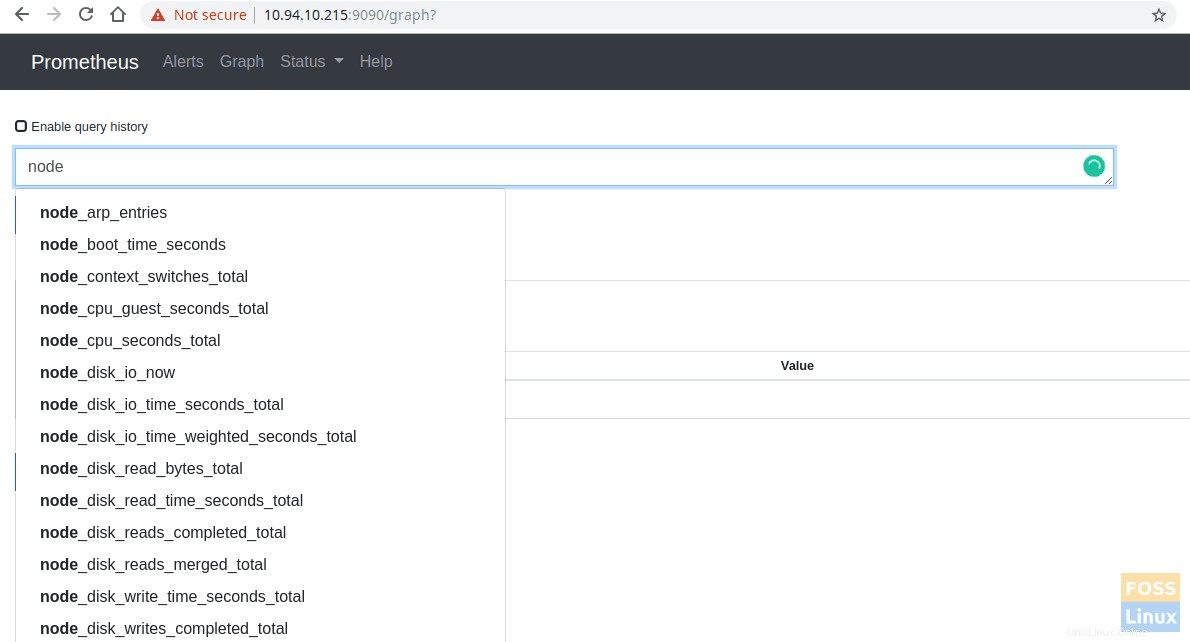
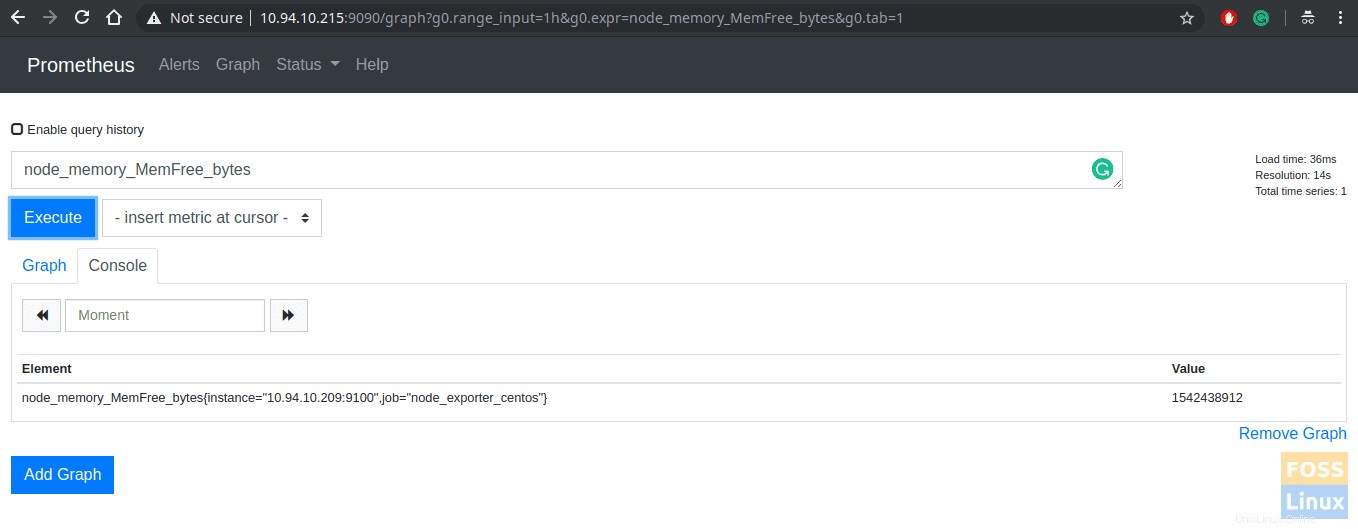
グラフをクリックして任意のサーバーメトリックをクエリし、[実行]をクリックして出力を表示できます。コンソール出力が表示されます。
クエリブラウザ:
コンソール出力:
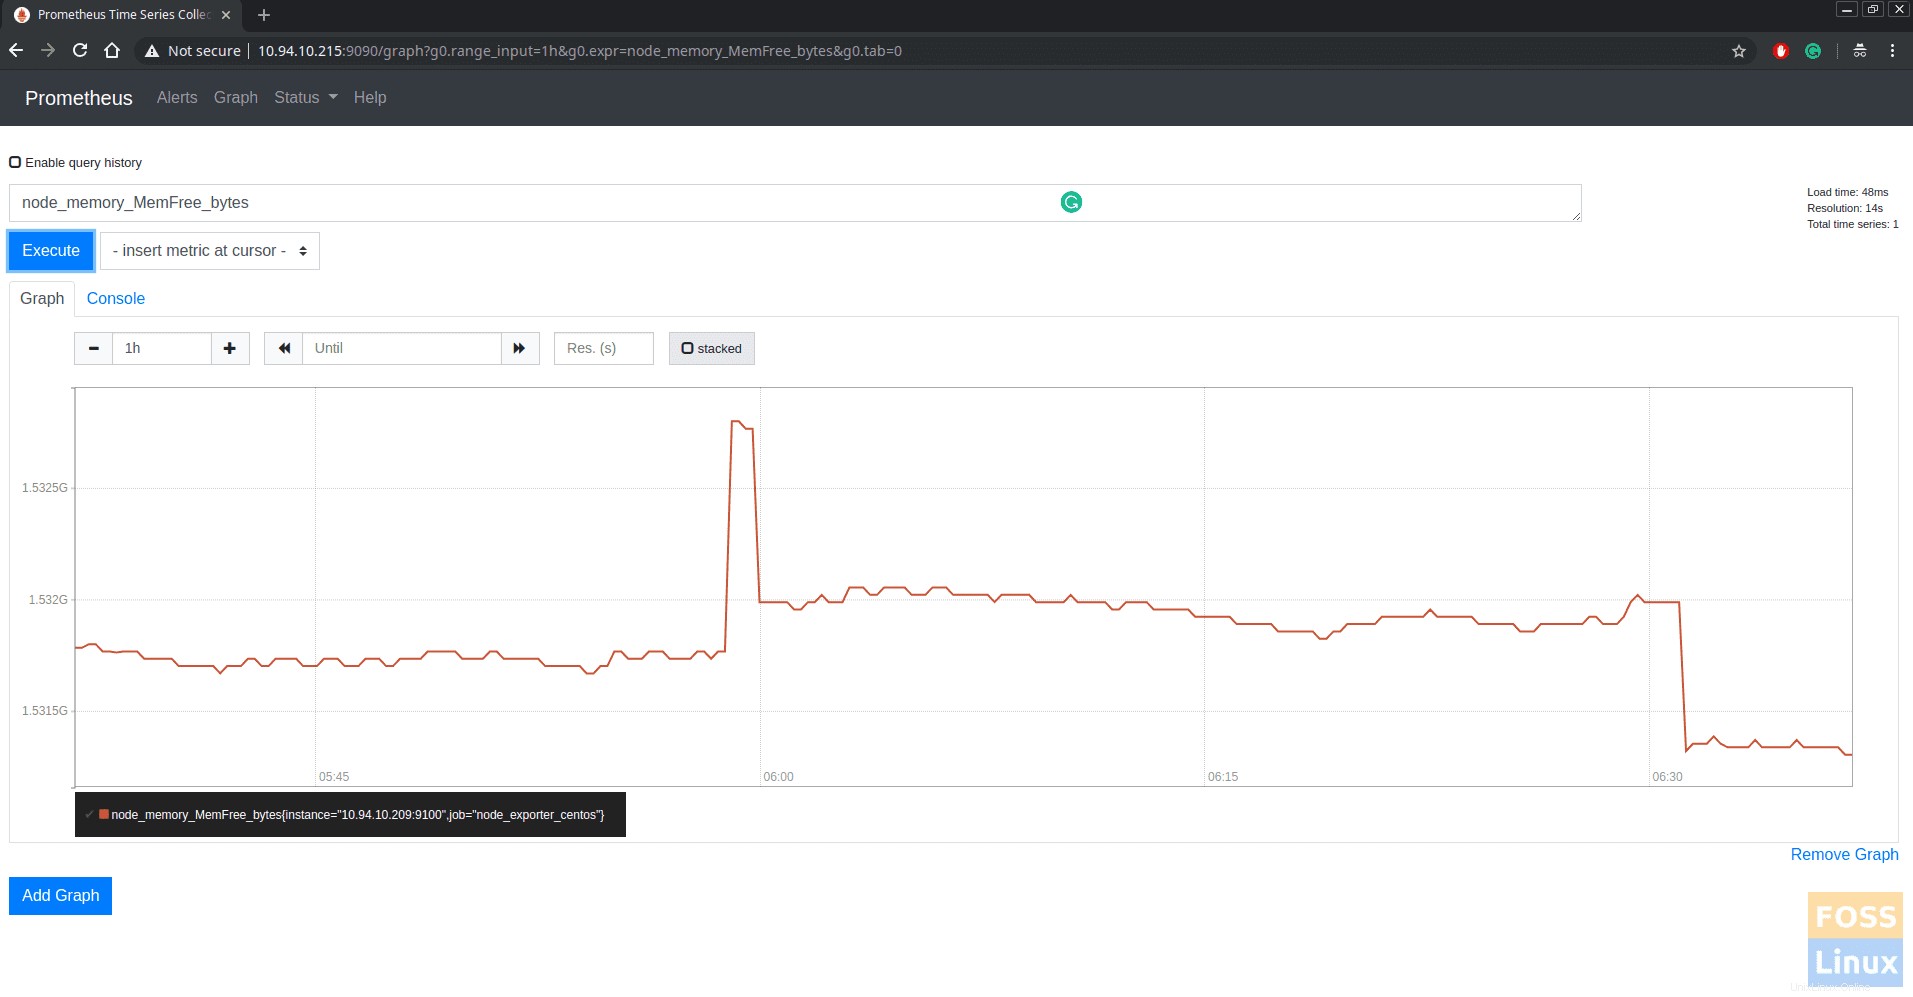
グラフをクリックして表示します。
ステップ7–Prometheusを使用してMySQLサーバーを監視する
MySQLにログインして、次のクエリを実行します。
CREATE USER 'mysqlexporter'@'localhost' IDENTIFIED BY 's56fsg#4W2126&dfk' WITH max_user_connections 2;
GRANT PROCESS, REPLICATION CLIENT, SELECT ON *.* TO 'mysqlexporter'@'localhost';
FLUSH PRIVILEGES;
公式ダウンロードページからmysqld_exporterをダウンロードします。
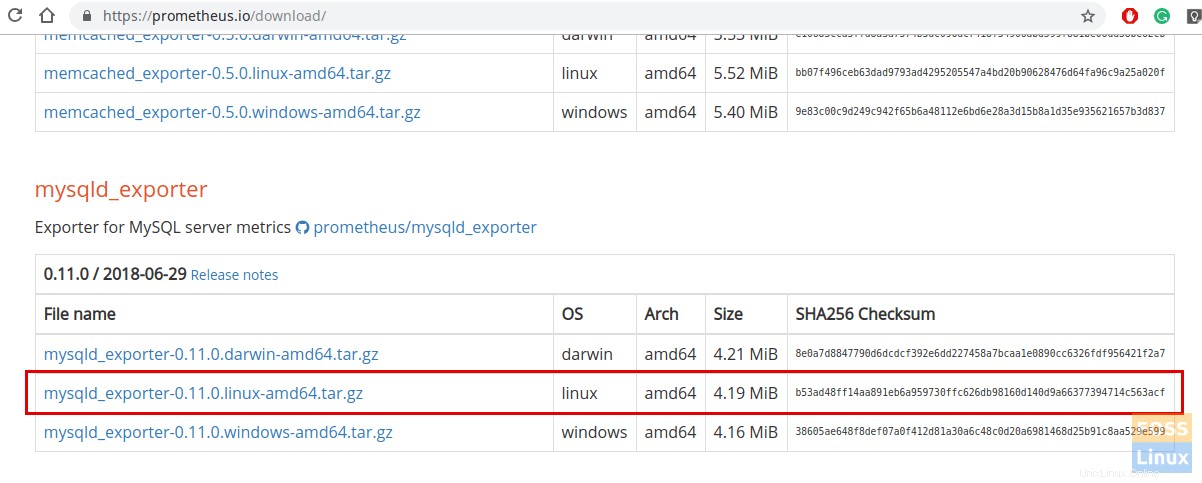
wget https://github.com/prometheus/mysqld_exporter/releases/download/v0.11.0/mysqld_exporter-0.11.0.linux-amd64.tar.gz
ダウンロードしたファイルを解凍します。
tar -xvzf mysqld_exporter-0.11.0.linux-amd64.tar.gz
mysqld_exporterのユーザーを追加します。
useradd -rs /bin/false mysqld_exporter
mysqld_exporterファイルを/usr/binにコピーします。
mv mysqld_exporter-0.11.0.linux-amd64/mysqld_exporter /usr/bin
ファイルの所有権を変更します。
chown mysqld_exporter:mysqld_exporter /usr/bin/mysqld_exporter
必要なフォルダを作成します。
mkdir -p /etc/mysql_exporter
mysqld_exporterのMySQLパスワードファイルを作成します。
vim /etc/mysql_exporter/.my.cnf
次の構成をファイルに追加します。
[client]
user=mysqlexporter
password=sdfsg#4W2126&gh
ファイルを保存して終了します。
所有権を変更します。
chown -R mysqld_exporter:mysqld_exporter /etc/mysql_exporter
必要な許可を与えます。
chmod 600 /etc/mysql_exporter/.my.cnf
サービスファイルを作成します。
vim /etc/systemd/system/mysql_exporter.service
次のコンテンツをファイルに追加します。
[Unit]
Description=MySQL Server fosslinux
After=network.target

[Service]
User=mysqld_exporter
Group=mysqld_exporter
Type=simple
ExecStart=/usr/bin/mysqld_exporter \
--config.my-cnf="/etc/mysql_exporter/.my.cnf"
Restart=always

[Install]
WantedBy=multi-user.target
システムデーモンをリロードします。
systemctl daemon-reload
システムの起動時にmysql_exporterを有効にします。
systemctl enable mysql_exporter
サービスを開始します。
systemctl start mysql_exporter
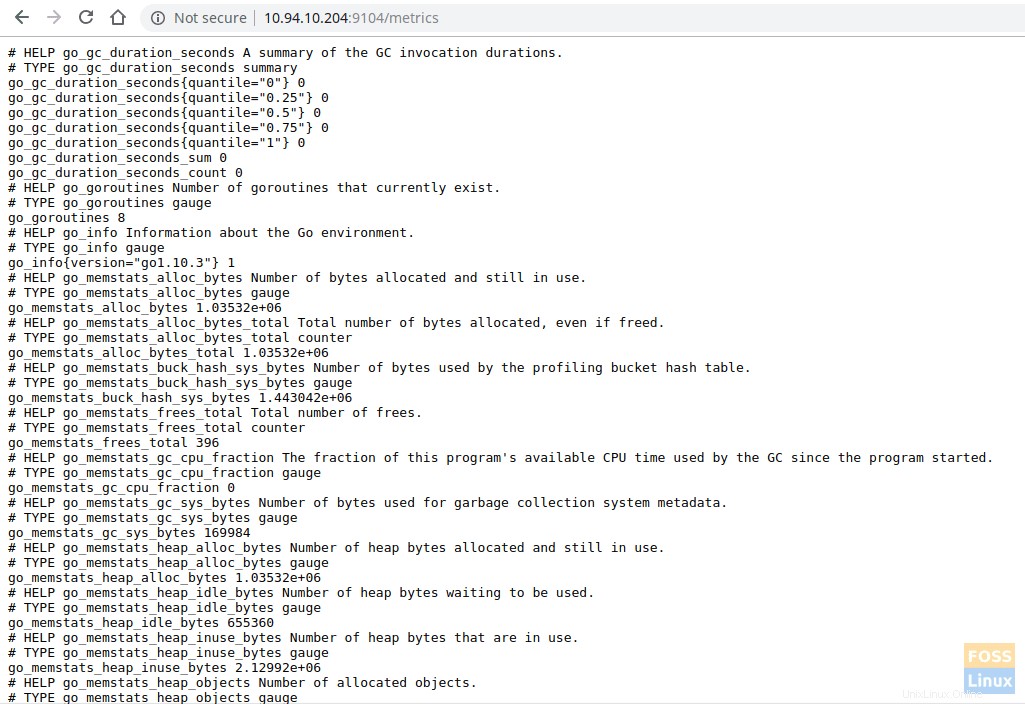
次のURLを使用して指標を表示します。
http://Server_IP:9104/metrics
次に、Prometheusサーバーに移動し、prometheus.ymlファイルを変更します。
vim /etc/prometheus/prometheus.yml
次のコンテンツをファイルに追加します。
- job_name: 'mysql_exporter_fosslinux'
    scrape_interval: 5s
    static_configs:
- targets: ['10.94.10.204:9104'] 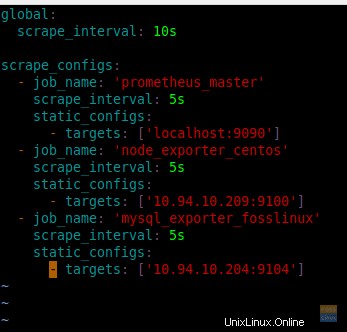
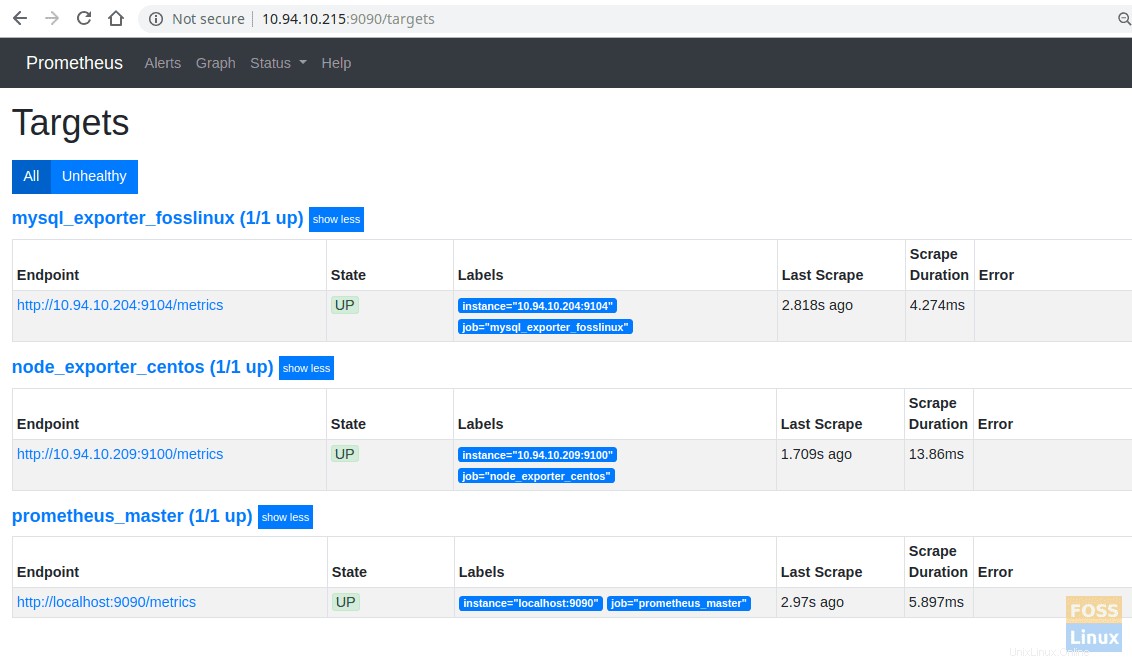
Prometheusを再起動します。
systemctl restart prometheus
ステータスの下にあるターゲットをクリックすると、追加されたターゲットを確認できます。
http://IP:9090/targets
これで、クエリブラウザを使用してクエリを選択し、MySQLサーバーの結果を取得できます。
CentOS7でのPrometheusサーバーのインストールと構成については以上です。このチュートリアルを楽しんでいただけたでしょうか。以下のコメントでフィードバックをお寄せください。