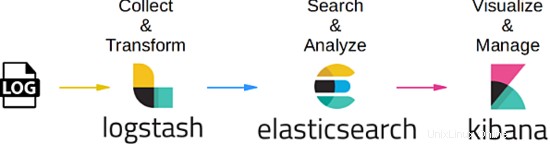
このチュートリアルでは、CentOS 7でELKスタックを使用して一元化されたログファイル管理サーバーをセットアップする方法について説明します。ELKは、ElasticSearch、Logstash、Kibanaの3つのサービスを組み合わせたものです。この概念を使用して完全な集中型ログ管理サーバーを構築するには、このパッケージがそれぞれ異なる目的を果たし、相互に関連しているため、このパッケージをそれぞれ用意する必要があります。基本的には次のように連携します:
- 管理するクライアントごとに、関連するサービスの独自のログが生成されます。
- 各クライアントからのすべてのログ情報を管理するために使用されるサーバーの場合、LogStashパッケージを使用してデータを収集し、相対値に変換します。定義上、これはオープンソースのサーバー側データ処理パイプラインであり、多数のソースから同時にデータを取り込み、変換します。
- データが収集されて変換されると、管理サーバーはElasticSearchを使用して、データを適切な値に分析します。必要に応じて関連するレポートを作成する場合は、一般的なクエリ言語を使用できます
- 関連データの検証と分析が行われると、Kibanaパッケージが浮かび上がります。これは、関連データを視覚化して適切なビューに管理したり、理解しやすいように望ましい光沢のあるダッシュボードに組み合わせたりするのに役立ちます。
次の図は、ワークフロープロセスをまとめたものです。
1。予備的注意
このチュートリアルでは、64ビットバージョンのCentOSLinux7.4を使用しています。このチュートリアルでは、3台のサーバーを使用します。最初のサーバーは管理サーバーとして使用され、他の2台はクライアントとして使用されます。この演習では、管理サーバーを使用して、各クライアントですでにセットアップ、構成、および実行されている既存のMySQLサービスを監視します。 MySQLは主にOLTPの目的で使用されるデータベースサービスであるため、MySQLサービス自体のヘルスチェックと低速のクエリトランザクションである2つのログプロセスをログに記録するように管理サーバーを作成します。このチュートリアルの終わりまでに、専用クライアント内のMySQLサービスからログに記録された情報を、管理サーバーから直接リアルタイムで同時に表示、視覚化、分析できることがわかります。
2。インストールフェーズ
インストールフェーズでは、クライアントとして機能する両方のMySQLDBサーバーへのFileBeatのインストールから開始します。プロセスを開始しましょう。手順は次のとおりです。
 [[email protected]_db1 opt]# cd
[[email protected]_db1 ~]# cd /opt/
[[email protected]_db1 opt]# wget https://artifacts.elastic.co/downloads/beats/filebeat/filebeat-6.2.1-x86_64.rpm
--2018-06-09 10:50:46-- https://artifacts.elastic.co/downloads/beats/filebeat/filebeat-6.2.1-x86_64.rpm
Resolving artifacts.elastic.co (artifacts.elastic.co)... 107.21.237.188, 107.21.253.15, 184.73.245.233, ...
Connecting to artifacts.elastic.co (artifacts.elastic.co)|107.21.237.188|:443... connected.
HTTP request sent, awaiting response... 200 OK
Length: 12697093 (12M) [binary/octet-stream]
Saving to: ‘filebeat-6.2.1-x86_64.rpm’

100%[==============================================================================>] 12,697,093 2.20MB/s in 6.9s

2018-06-09 10:51:00 (1.75 MB/s) - ‘filebeat-6.2.1-x86_64.rpm’ saved [12697093/12697093]

[[email protected]_db1 opt]# yum localinstall -y filebeat-6.2.1-x86_64.rpm
Loaded plugins: fastestmirror, ovl
Examining filebeat-6.2.1-x86_64.rpm: filebeat-6.2.1-1.x86_64
Marking filebeat-6.2.1-x86_64.rpm to be installed
Resolving Dependencies
--> Running transaction check
---> Package filebeat.x86_64 0:6.2.1-1 will be installed
--> Finished Dependency Resolution

Dependencies Resolved

========================================================================================================================
Package Arch Version Repository Size
========================================================================================================================
Installing:
filebeat x86_64 6.2.1-1 /filebeat-6.2.1-x86_64 49 M

Transaction Summary
========================================================================================================================
Install 1 Package

Total size: 49 M
Installed size: 49 M
Downloading packages:
Running transaction check
Running transaction test
Transaction test succeeded
Running transaction
Installing : filebeat-6.2.1-1.x86_64 1/1
Verifying : filebeat-6.2.1-1.x86_64 1/1

Installed:
filebeat.x86_64 0:6.2.1-1

Complete!
完了したら、FileBeatパッケージで有効にするデフォルトのモジュールをリストし、ここでのケースに必要なmysqlモジュールを有効にします。手順は次のとおりです。
 [[email protected]_db1 opt]# filebeat modules list
Enabled:

Disabled:
apache2
auditd
icinga
kafka
logstash
mysql
nginx
osquery
postgresql
redis
system
traefik
[[email protected]_db1 opt]# filebeat modules enable mysql
Enabled mysql
これで、今有効にしたmysqlモジュールに必要な構成を編集しましょう。デフォルトでは、filebeatパッケージからmysqlモジュールを有効にすると、modules.dディレクトリ内にyamlファイルが自動的に作成されます。ただし、ファイルが作成されていない場合は、同じ場所に新しいyamlファイルを自由に作成してください。手順は次のとおりです。
 [[email protected]_db1 opt]# vi /etc/filebeat/modules.d/mysql.yml
- module: mysql
error:
enabled: true
var.paths: ["/var/lib/mysql/mysql-error.log*"]

slowlog:
enabled: true
var.paths: ["/var/lib/mysql/log-slow-queries.log*"]
上に示したように、データベース自体のヘルスチェックと遅いクエリログであるMySQLサービスからの2つのロギングプロセスをログに記録することにしました。
すべてが完了したら、filebeat.ymlファイルの下にあるfilebeatのメイン構成ファイル内にいくつかの構成を作成しましょう。構成セットは次のとおりです。
 [[email protected]_db1 opt]# vi /etc/filebeat/filebeat.yml
#=========================== Filebeat prospectors =============================

filebeat.prospectors:

- type: log

enabled: false
paths:
- /var/lib/mysql/mysql-error.log
- /var/lib/mysql/log-slow-queries.log

#============================= Filebeat modules ===============================

filebeat.config.modules:
path: ${path.config}/modules.d/*.yml
reload.enabled: false

#==================== Elasticsearch template setting ==========================

setup.template.settings:
index.number_of_shards: 3

#================================ General =====================================

setup.kibana:

#----------------------------- Logstash output --------------------------------
output.logstash:
hosts: ["172.17.0.6:5044"]
上記で、ログスタッシュホストのIPアドレスを172.17.0.6に設定していることに注意してください。このIPは、ログデータを収集するために直接クロールする集中管理サーバーのアドレスです。 / etc / hostsファイルで代替の変更を行わず、このチュートリアルではDNSサーバーを使用しなかったため、ハードコードされたIPを設定しました。ただし、別の変更を加えた場合は、管理サーバーのホスト名を自由に使用してください。
すべてが計画どおりにセットアップされたので、filebeatサービスを開始しましょう。手順は次のとおりです。
 [[email protected]_db1 opt]# filebeat setup -e
2018-06-09T11:04:37.277Z INFO instance/beat.go:468 Home path: [/usr/share/filebeat] Config path: [/etc/filebeat] Data path: [/var/lib/filebeat] Logs path: [/var/log/filebeat]
2018-06-09T11:04:37.277Z INFO instance/beat.go:475 Beat UUID: 98503460-035e-4476-8e4d-10470433dba5
2018-06-09T11:04:37.277Z INFO instance/beat.go:213 Setup Beat: filebeat; Version: 6.2.1
2018-06-09T11:04:37.277Z INFO pipeline/module.go:76 Beat name: lara
2018-06-09T11:04:37.278Z ERROR instance/beat.go:667 Exiting: Template loading requested but the Elasticsearch output is not configured/enabled
Exiting: Template loading requested but the Elasticsearch output is not configured/enabled


[[email protected]_db1 opt]# filebeat -e &
[1] 22010
[[email protected]_db1 opt]# 2018-06-09T12:45:18.812Z INFO instance/beat.go:468 Home path: [/usr/share/filebeat] Config path: [/etc/filebeat] Data path: [/var/lib/filebeat] Logs path: [/var/log/filebeat]
2018-06-09T12:45:18.813Z INFO instance/beat.go:475 Beat UUID: 98503460-035e-4476-8e4d-10470433dba5
2018-06-09T12:45:18.813Z INFO instance/beat.go:213 Setup Beat: filebeat; Version: 6.2.1
2018-06-09T12:45:18.813Z INFO pipeline/module.go:76 Beat name: lara
2018-06-09T12:45:18.813Z INFO [monitoring] log/log.go:97 Starting metrics logging every 30s
2018-06-09T12:45:18.813Z INFO instance/beat.go:301 filebeat start running.
2018-06-09T12:45:18.814Z INFO registrar/registrar.go:71 No registry file found under: /var/lib/filebeat/registry. Creating a new registry file.
2018-06-09T12:45:18.819Z INFO registrar/registrar.go:108 Loading registrar data from /var/lib/filebeat/registry
2018-06-09T12:45:18.819Z INFO registrar/registrar.go:119 States Loaded from registrar: 0
2018-06-09T12:45:18.819Z WARN beater/filebeat.go:261 Filebeat is unable to load the Ingest Node pipelines for the configured modules because the Elasticsearch output is not configured/enabled. If you have already loaded the Ingest Node pipelines or are using Logstash pipelines, you can ignore this warning.
2018-06-09T12:45:18.820Z INFO crawler/crawler.go:48 Loading Prospectors: 1
2018-06-09T12:45:18.821Z INFO log/prospector.go:111 Configured paths: [/var/lib/mysql/log-slow-queries.log*]
2018-06-09T12:45:18.822Z INFO log/prospector.go:111 Configured paths: [/var/lib/mysql/mysql-error.log*]
2018-06-09T12:45:18.822Z INFO crawler/crawler.go:82 Loading and starting Prospectors completed. Enabled prospectors: 0
2018-06-09T12:45:18.822Z INFO cfgfile/reload.go:127 Config reloader started
2018-06-09T12:45:18.840Z INFO log/prospector.go:111 Configured paths: [/var/lib/mysql/log-slow-queries.log*]
2018-06-09T12:45:18.840Z INFO log/prospector.go:111 Configured paths: [/var/lib/mysql/mysql-error.log*]
2018-06-09T12:45:18.840Z INFO cfgfile/reload.go:258 Starting 1 runners ...
2018-06-09T12:45:18.840Z INFO cfgfile/reload.go:219 Loading of config files completed.
2018-06-09T12:45:18.841Z INFO log/harvester.go:216 Harvester started for file: /var/lib/mysql/mysql-error.log
2018-06-09T12:45:18.841Z INFO log/harvester.go:216 Harvester started for file: /var/lib/mysql/log-slow-queries.log
2018-06-09T12:45:20.841Z ERROR pipeline/output.go:74 Failed to connect: dial tcp 172.17.0.6:5044: getsockopt: connection refused
2018-06-09T12:45:22.842Z ERROR pipeline/output.go:74 Failed to connect: dial tcp 172.17.0.6:5044: getsockopt: connection refused
2018-06-09T12:45:26.842Z ERROR pipeline/output.go:74 Failed to connect: dial tcp 172.17.0.6:5044: getsockopt: connection refused


[[email protected]_db1 ~]# tail -f /var/log/filebeat/filebeat
2018-06-09T10:53:28.853Z INFO instance/beat.go:468 Home path: [/usr/share/filebeat] Config path: [/etc/filebeat] Data path: [/var/lib/filebeat] Logs path: [/var/log/filebeat]
2018-06-09T10:53:28.853Z INFO instance/beat.go:475 Beat UUID: 98503460-035e-4476-8e4d-10470433dba5
filebeatサービスを起動すると、ログの下にエラーが表示されることに注意してください。これは、割り当てられた管理サーバーがまだセットアップされていないことが原因でした。初期段階では、管理サーバーがセットアップされてクロールが開始されると自動的に回復されるため、エラーログを無視できます。
クライアントベースの構成が完了したら、クライアントとしても機能する他のMySQLサーバーで手順を複製し続けることができます。
今後も、管理サーバー自体のセットアップを継続していきます。
3。インストールフェーズ(集中管理サーバー側)
クライアント側の準備が整ったので、管理サーバー自体に必要な構成を起動してみましょう。簡単に説明すると、管理サーバー用にインストールおよび構成する必要のある3つのコアパッケージがあります。ElasticSearch、LogStash、およびKibanaです。
このフェーズでは、最初にElasticSearchに必要なインストールと構成を開始します。手順は、次のとおりです。
 [[email protected]_master ~]# cd /opt/
[[email protected]_master opt]# ls
[[email protected]_master opt]# wget https://artifacts.elastic.co/downloads/elasticsearch/elasticsearch-6.2.1.tar.gz
--2018-06-09 12:47:59-- https://artifacts.elastic.co/downloads/elasticsearch/elasticsearch-6.2.1.tar.gz
Resolving artifacts.elastic.co (artifacts.elastic.co)... 107.21.237.188, 54.235.82.130, 107.21.253.15, ...
Connecting to artifacts.elastic.co (artifacts.elastic.co)|107.21.237.188|:443... connected.
HTTP request sent, awaiting response... 200 OK
Length: 29049089 (28M) [binary/octet-stream]
Saving to: ‘elasticsearch-6.2.1.tar.gz’

100%[==============================================================================>] 29,049,089 2.47MB/s in 16s

2018-06-09 12:48:21 (1.76 MB/s) - ‘elasticsearch-6.2.1.tar.gz’ saved [29049089/29049089]

[[email protected]_master opt]#
[[email protected]_master opt]#
[[email protected]_master opt]# tar -zxvf elasticsearch-6.2.1.tar.gz

[[email protected]_master opt]# ln -s /opt/elasticsearch-6.2.1 /opt/elasticsearch
[[email protected]_master opt]# ll
total 28372
lrwxrwxrwx 1 root root 24 Jun 9 12:49 elasticsearch -> /opt/elasticsearch-6.2.1
drwxr-xr-x 8 root root 143 Feb 7 19:36 elasticsearch-6.2.1
-rw-r--r-- 1 root root 29049089 May 15 04:56 elasticsearch-6.2.1.tar.gz
Elasticsearchのインストールが完了したら、構成部分を続けましょう。構成側では、ディレクトリ/ data / dataを割り当てて、分析された収集されたログデータを保存します。ディレクトリ自体は、elasticSearch自体がクエリを高速化するために使用するインデックスを格納するためにも使用されます。ディレクトリの場合、/ data / logsは、elasticSearch自体が独自のログ記録目的で使用します。手順は次のとおりです。
 [[email protected]_master opt]# mkdir -p /data/data
[[email protected]_master opt]# mkdir -p /data/logs
[[email protected]_master opt]#
[[email protected]_master opt]# cd elasticsearch
[[email protected]_master elasticsearch]# ls
bin config lib LICENSE.txt logs modules NOTICE.txt plugins README.textile
[[email protected]_master elasticsearch]# cd config/
[[email protected]_master config]# vi elasticsearch.yml
# ---------------------------------- Cluster -----------------------------------
cluster.name: log_cluster
#
# ------------------------------------ Node ------------------------------------
#
node.name: elk_master
#
# ----------------------------------- Paths ------------------------------------
#
path.data: /data/data
path.logs: /data/logs
#
network.host: 172.17.0.6
完了しました。ElasticSearchが機能するには、Javaをセットアップする必要があります。以下は、Javaをサーバーにインストールして構成する手順です。
 [[email protected]_master config]# wget --no-cookies --no-check-certificate --header "Cookie: gpw_e24=http%3A%2F%2Fwww.oracle.com%2F; oraclelicense=accept-securebackup-cookie" "http://download.oracle.com/otn-pub/java/jdk/8u131-b11/d54c1d3a095b4ff2b6607d096fa80163/jdk-8u131-linux-x64.rpm"
--2018-06-09 12:57:05-- http://download.oracle.com/otn-pub/java/jdk/8u131-b11/d54c1d3a095b4ff2b6607d096fa80163/jdk-8u131-linux-x64.rpm
Resolving download.oracle.com (download.oracle.com)... 23.49.16.62
Connecting to download.oracle.com (download.oracle.com)|23.49.16.62|:80... connected.
HTTP request sent, awaiting response... 302 Moved Temporarily
Location: https://edelivery.oracle.com/otn-pub/java/jdk/8u131-b11/d54c1d3a095b4ff2b6607d096fa80163/jdk-8u131-linux-x64.rpm [following]
--2018-06-09 12:57:10-- https://edelivery.oracle.com/otn-pub/java/jdk/8u131-b11/d54c1d3a095b4ff2b6607d096fa80163/jdk-8u131-linux-x64.rpm
Resolving edelivery.oracle.com (edelivery.oracle.com)... 104.103.48.174, 2600:1417:58:181::2d3e, 2600:1417:58:188::2d3e
Connecting to edelivery.oracle.com (edelivery.oracle.com)|104.103.48.174|:443... connected.
HTTP request sent, awaiting response... 302 Moved Temporarily
Location: http://download.oracle.com/otn-pub/java/jdk/8u131-b11/d54c1d3a095b4ff2b6607d096fa80163/jdk-8u131-linux-x64.rpm?AuthParam=1528549151_b1fd01d854bc0423600a83c36240028e [following]
--2018-06-09 12:57:11-- http://download.oracle.com/otn-pub/java/jdk/8u131-b11/d54c1d3a095b4ff2b6607d096fa80163/jdk-8u131-linux-x64.rpm?AuthParam=1528549151_b1fd01d854bc0423600a83c36240028e
Connecting to download.oracle.com (download.oracle.com)|23.49.16.62|:80... connected.
HTTP request sent, awaiting response... 200 OK
Length: 169983496 (162M) [application/x-redhat-package-manager]
Saving to: ‘jdk-8u131-linux-x64.rpm’

100%[==============================================================================>] 169,983,496 2.56MB/s in 64s

2018-06-09 12:58:15 (2.54 MB/s) - ‘jdk-8u131-linux-x64.rpm’ saved [169983496/169983496]

[[email protected]_master config]# yum localinstall -y jdk-8u131-linux-x64.rpm


[[email protected]_master config]# vi /root/.bash_profile
export JAVA_HOME=/usr/java/jdk1.8.0_131
PATH=$JAVA_HOME/bin:$PATH:$HOME/bin
export PATH

[[email protected]_master config]# . /root/.bash_profile
[[email protected]_master config]# java -version
java version "1.8.0_131"
Java(TM) SE Runtime Environment (build 1.8.0_131-b11)
Java HotSpot(TM) 64-Bit Server VM (build 25.131-b11, mixed mode)
これで、elasticSearchがサーバーにインストールおよび構成されました。ただし、一部のセキュリティポリシーにより、elasticSearchをユーザーrootで実行することは禁止されているため、elasticSearchサービスの所有者となる追加のユーザーを作成して実行します。専用ユーザーを作成する手順は次のとおりです。
 [[email protected]_master config]# useradd -s /bin/bash shahril
[[email protected]_master config]# passwd shahril
Changing password for user shahril.
New password:
BAD PASSWORD: The password fails the dictionary check - it is too simplistic/systematic
Retype new password:
passwd: all authentication tokens updated successfully.

[[email protected]_master config]# chown -R shahril:shahril /data/
[[email protected]_master config]# sysctl -w vm.max_map_count=262144
vm.max_map_count = 262144
完了したら、ユーザーとしてログインすると、elasticSearchサービスを開始できます。
 [[email protected]_master config]# su - shahril
Last login: Sat Jun 9 13:03:07 UTC 2018 on pts/1
[[email protected]_master ~]$
[[email protected]_master ~]$
[[email protected]_master ~]$
[[email protected]_master ~]$ /opt/elasticsearch/bin/elasticsearch &
[1] 7295
[[email protected]_master ~]$ [2018-06-09T13:06:26,667][INFO ][o.e.n.Node ] [elk_master] initializing ...
[2018-06-09T13:06:26,721][INFO ][o.e.e.NodeEnvironment ] [elk_master] using [1] data paths, mounts [[/ (rootfs)]], net usable_space [394.3gb], net total_space [468.2gb], types [rootfs]
[2018-06-09T13:06:26,722][INFO ][o.e.e.NodeEnvironment ] [elk_master] heap size [990.7mb], compressed ordinary object pointers [true]
[2018-06-09T13:06:26,723][INFO ][o.e.n.Node ] [elk_master] node name [elk_master], node ID [xjNoA9mMSGiXYmFPRNlXBg]
[2018-06-09T13:06:26,723][INFO ][o.e.n.Node ] [elk_master] version[6.2.1], pid[7295], build[7299dc3/2018-02-07T19:34:26.990113Z], OS[Linux/3.10.0-693.17.1.el7.x86_64/amd64], JVM[Oracle Corporation/Java HotSpot(TM) 64-Bit Server VM/1.8.0_131/25.131-b11]
[2018-06-09T13:06:26,723][INFO ][o.e.n.Node ] [elk_master] JVM arguments [-Xms1g, -Xmx1g, -XX:+UseConcMarkSweepGC, -XX:CMSInitiatingOccupancyFraction=75, -XX:+UseCMSInitiatingOccupancyOnly, -XX:+AlwaysPreTouch, -Xss1m, -Djava.awt.headless=true, -Dfile.encoding=UTF-8, -Djna.nosys=true, -XX:-OmitStackTraceInFastThrow, -Dio.netty.noUnsafe=true, -Dio.netty.noKeySetOptimization=true, -Dio.netty.recycler.maxCapacityPerThread=0, -Dlog4j.shutdownHookEnabled=false, -Dlog4j2.disable.jmx=true, -Djava.io.tmpdir=/tmp/elasticsearch.U6ilAwt9, -XX:+HeapDumpOnOutOfMemoryError, -XX:+PrintGCDetails, -XX:+PrintGCDateStamps, -XX:+PrintTenuringDistribution, -XX:+PrintGCApplicationStoppedTime, -Xloggc:logs/gc.log, -XX:+UseGCLogFileRotation, -XX:NumberOfGCLogFiles=32, -XX:GCLogFileSize=64m, -Des.path.home=/opt/elasticsearch, -Des.path.conf=/opt/elasticsearch/config]
[2018-06-09T13:06:27,529][INFO ][o.e.p.PluginsService ] [elk_master] loaded module [aggs-matrix-stats]
[2018-06-09T13:06:27,529][INFO ][o.e.p.PluginsService ] [elk_master] loaded module [analysis-common]
[2018-06-09T13:06:27,529][INFO ][o.e.p.PluginsService ] [elk_master] loaded module [ingest-common]
[2018-06-09T13:06:27,530][INFO ][o.e.p.PluginsService ] [elk_master] loaded module [lang-expression]
[2018-06-09T13:06:27,530][INFO ][o.e.p.PluginsService ] [elk_master] loaded module [lang-mustache]
[2018-06-09T13:06:27,530][INFO ][o.e.p.PluginsService ] [elk_master] loaded module [lang-painless]
[2018-06-09T13:06:27,530][INFO ][o.e.p.PluginsService ] [elk_master] loaded module [mapper-extras]
[2018-06-09T13:06:27,530][INFO ][o.e.p.PluginsService ] [elk_master] loaded module [parent-join]
[2018-06-09T13:06:27,530][INFO ][o.e.p.PluginsService ] [elk_master] loaded module [percolator]
[2018-06-09T13:06:27,531][INFO ][o.e.p.PluginsService ] [elk_master] loaded module [rank-eval]
[2018-06-09T13:06:27,532][INFO ][o.e.p.PluginsService ] [elk_master] loaded module [reindex]
[2018-06-09T13:06:27,532][INFO ][o.e.p.PluginsService ] [elk_master] loaded module [repository-url]
[2018-06-09T13:06:27,533][INFO ][o.e.p.PluginsService ] [elk_master] loaded module [transport-netty4]
[2018-06-09T13:06:27,533][INFO ][o.e.p.PluginsService ] [elk_master] loaded module [tribe]
[2018-06-09T13:06:27,534][INFO ][o.e.p.PluginsService ] [elk_master] no plugins loaded
すばらしい、elasticSearchが問題なく稼働しているので、elasticSearchサービスに関連する追加のポートがサーバー内に確立されていることに気付くでしょう。以下のようにリストされたポートを確認できます:
 [[email protected]_master config]# netstat -apn|grep -i :9
tcp 0 0 172.17.0.6:9200 0.0.0.0:* LISTEN 7295/java
tcp 0 0 172.17.0.6:9300 0.0.0.0:* LISTEN 7295/java
それでは、logstashサービスの設定と構成に移りましょう。インストールプロセスに必要な手順は次のとおりです。
 [[email protected]_master opt]# wget https://artifacts.elastic.co/downloads/logstash/logstash-6.2.1.rpm
--2018-06-09 13:07:51-- https://artifacts.elastic.co/downloads/logstash/logstash-6.2.1.rpm
Resolving artifacts.elastic.co (artifacts.elastic.co)... 107.21.253.15, 23.21.67.46, 107.21.237.188, ...
Connecting to artifacts.elastic.co (artifacts.elastic.co)|107.21.253.15|:443... connected.
HTTP request sent, awaiting response... 200 OK
Length: 140430729 (134M) [binary/octet-stream]
Saving to: ‘logstash-6.2.1.rpm’

100%[==============================================================================>] 140,430,729 2.19MB/s in 60s

2018-06-09 13:08:57 (2.24 MB/s) - ‘logstash-6.2.1.rpm’ saved [140430729/140430729]

[[email protected]_master opt]# yum localinstall -y logstash-6.2.1.rpm
Loaded plugins: fastestmirror, ovl
Examining logstash-6.2.1.rpm: 1:logstash-6.2.1-1.noarch
Marking logstash-6.2.1.rpm to be installed
Resolving Dependencies
--> Running transaction check
---> Package logstash.noarch 1:6.2.1-1 will be installed
--> Finished Dependency Resolution

Dependencies Resolved

========================================================================================================================
Package Arch Version Repository Size
========================================================================================================================
Installing:
logstash noarch 1:6.2.1-1 /logstash-6.2.1 224 M

Transaction Summary
========================================================================================================================
Install 1 Package

Total size: 224 M
Installed size: 224 M
Downloading packages:
Running transaction check
Running transaction test
Transaction test succeeded
Running transaction
Installing : 1:logstash-6.2.1-1.noarch 1/1
Using provided startup.options file: /etc/logstash/startup.options
Successfully created system startup script for Logstash
Verifying : 1:logstash-6.2.1-1.noarch 1/1

Installed:
logstash.noarch 1:6.2.1-1

Complete!
インストールが完了したら、以下のように必要な構成を適用します。
 [[email protected]_master opt]# vi /etc/logstash/conf.d/02-mysql-log.conf

input {
beats {
port => 5044
host => "0.0.0.0"
}
}


filter {
if [fileset][module] == "mysql" {
if [fileset][name] == "error" {
grok {
match => { "message" => ["%{LOCALDATETIME:[mysql][error][timestamp]} (\[%{DATA:[mysql][error][level]}\] )?%{GREEDYDATA:[mysql][error][message]}",
"%{TIMESTAMP_ISO8601:[mysql][error][timestamp]} %{NUMBER:[mysql][error][thread_id]} \[%{DATA:[mysql][error][level]}\] %{GREEDYDATA:[mysql][error][message1]}",
"%{GREEDYDATA:[mysql][error][message2]}"] }
pattern_definitions => {
"LOCALDATETIME" => "[0-9]+ %{TIME}"
}
remove_field => "message"
}
mutate {
rename => { "[mysql][error][message1]" => "[mysql][error][message]" }
}
mutate {
rename => { "[mysql][error][message2]" => "[mysql][error][message]" }
}
date {
match => [ "[mysql][error][timestamp]", "ISO8601", "YYMMdd H:m:s" ]
remove_field => "[mysql][error][time]"
}
}
else if [fileset][name] == "slowlog" {
grok {
match => { "message" => ["^# [email protected]: %{USER:[mysql][slowlog][user]}(\[[^\]]+\])? @ %{HOSTNAME:[mysql][slowlog][host]} \[(IP:[mysql][slowlog][ip])?\](\s*Id:\s* %{NUMBER:[mysql][slowlog][id]})?\n# Query_time: %{NUMBER:[mysql][slowlog][query_time][sec]}\s* Lock_time: %{NUMBER:[mysql][slowlog][lock_time][sec]}\s* Rows_sent: %{NUMBER:[mysql][slowlog][rows_sent]}\s* Rows_examined: %{NUMBER:[mysql][slowlog][rows_examined]}\n(SET timestamp=%{NUMBER:[mysql][slowlog][timestamp]};\n)?%{GREEDYMULTILINE:[mysql][slowlog][query]}"] }
pattern_definitions => {
"GREEDYMULTILINE" => "(.|\n)*"
}
remove_field => "message"
}
date {
match => [ "[mysql][slowlog][timestamp]", "UNIX" ]
}
mutate {
gsub => ["[mysql][slowlog][query]", "\n# Time: [0-9]+ [0-9][0-9]:[0-9][0-9]:[0-9][0-9](\\.[0-9]+)?$", ""]
}
}
}
}


output {
elasticsearch {
hosts => "172.17.0.6"
manage_template => false
index => "%{[@metadata][beat]}-%{[@metadata][version]}-%{+YYYY.MM.dd}"
}
}
上記の構成から、ポート5044を使用するクライアント側のfilebeatサービスから入力を取得するように設定しました。また、logstashに適切な注釈を設定して、各クライアント側から取得した生データを整列させました。これは、elasticSearch側からの表示と分析を容易にするために必要です。
次に、logstashがクライアント側から生データをキャプチャしてクロールできるように、logstash用のfilebeatsモジュールをインストールする必要があります。
 [[email protected]_master opt]# /usr/share/logstash/bin/logstash-plugin install logstash-input-beats
Validating logstash-input-beats
Installing logstash-input-beats
Installation successful
logstashに必要なインストールと構成が完了すると、サービスを直接開始できます。手順は次のとおりです。
 [[email protected]_master opt]# service logstash restart
Redirecting to /bin/systemctl restart logstash.service

[[email protected]_master opt]# service logstash status
Redirecting to /bin/systemctl status logstash.service
? logstash.service - logstash
Loaded: loaded (/etc/systemd/system/logstash.service; disabled; vendor preset: disabled)
Active: active (running) since Sat 2018-06-09 13:17:40 UTC; 5s ago
Main PID: 8106 (java)
CGroup: /docker/2daaf895e0efa67ef70dbabd87b56d53815e94ff70432f692385f527e2dc488b/system.slice/logstash.service
??8106 /bin/java -Xms256m -Xmx1g -XX:+UseParNewGC -XX:+UseConcMarkSweepGC -XX:CMSInitiatingOccupancyFracti...

Jun 09 13:17:40 elk_master systemd[1]: Started logstash.
Jun 09 13:17:40 elk_master systemd[1]: Starting logstash...
[[email protected]_master opt]#

[[email protected]_master opt]# tail -f /var/log/logstash/logstash-plain.log
[2018-06-09T13:17:59,496][INFO ][logstash.outputs.elasticsearch] Elasticsearch pool URLs updated {:changes=>{:removed=>[], :added=>[http://172.17.0.6:9200/]}}
[2018-06-09T13:17:59,498][INFO ][logstash.outputs.elasticsearch] Running health check to see if an Elasticsearch connection is working {:healthcheck_url=>http://172.17.0.6:9200/, :path=>"/"}
[2018-06-09T13:17:59,976][WARN ][logstash.outputs.elasticsearch] Restored connection to ES instance {:url=>"http://172.17.0.6:9200/"}
[2018-06-09T13:18:00,083][INFO ][logstash.outputs.elasticsearch] ES Output version determined {:es_version=>nil}
[2018-06-09T13:18:00,083][WARN ][logstash.outputs.elasticsearch] Detected a 6.x and above cluster: the `type` event field won't be used to determine the document _type {:es_version=>6}
[2018-06-09T13:18:00,095][INFO ][logstash.outputs.elasticsearch] New Elasticsearch output {:class=>"LogStash::Outputs::ElasticSearch", :hosts=>["//172.17.0.6"]}
[2018-06-09T13:18:00,599][INFO ][logstash.inputs.beats ] Beats inputs: Starting input listener {:address=>"0.0.0.0:5044"}
[2018-06-09T13:18:00,652][INFO ][logstash.pipeline ] Pipeline started succesfully {:pipeline_id=>"main", :thread=>"#<Thread:[email protected]/usr/share/logstash/logstash-core/lib/logstash/pipeline.rb:246 sleep>"}
[2018-06-09T13:18:00,663][INFO ][org.logstash.beats.Server] Starting server on port: 5044
[2018-06-09T13:18:00,660][INFO ][logstash.agent ] Pipelines running {:count=>1, :pipelines=>["main"]}
[2018-06-09T13:18:24,060][INFO ][o.e.c.m.MetaDataCreateIndexService] [elk_master] [filebeat-6.2.1-2018.06.04] creating index, cause [auto(bulk api)], templates [], shards [5]/[1], mappings []
[2018-06-09T13:18:24,189][INFO ][o.e.c.m.MetaDataCreateIndexService] [elk_master] [filebeat-6.2.1-2018.06.09] creating index, cause [auto(bulk api)], templates [], shards [5]/[1], mappings []
[2018-06-09T13:18:24,288][INFO ][o.e.c.m.MetaDataCreateIndexService] [elk_master] [filebeat-6.2.1-2018.06.08] creating index, cause [auto(bulk api)], templates [], shards [5]/[1], mappings []
[2018-06-09T13:18:24,591][INFO ][o.e.c.m.MetaDataMappingService] [elk_master] [filebeat-6.2.1-2018.06.04/yPD91Ww0SD2ei4YI-FgLgQ] create_mapping [doc]
[2018-06-09T13:18:24,781][INFO ][o.e.c.m.MetaDataMappingService] [elk_master] [filebeat-6.2.1-2018.06.08/Qnv0gplFTgW0z1C6haZESg] create_mapping [doc]
[2018-06-09T13:18:24,882][INFO ][o.e.c.m.MetaDataMappingService] [elk_master] [filebeat-6.2.1-2018.06.09/dihjTJw3SjGncXYln2MXbA] create_mapping [doc]
[2018-06-09T13:18:24,996][INFO ][o.e.c.m.MetaDataMappingService] [elk_master] [filebeat-6.2.1-2018.06.09/dihjTJw3SjGncXYln2MXbA] update_mapping [doc]
As you can see, now logstash service have successfully started and starting to collect the data from each client side. As alternatives, you can use curl command to see the status and updates from logstash side. Below are the examples:
 [[email protected]_master opt]# curl -kL http://172.17.0.6:9200/_cat/indices?v
health status index uuid pri rep docs.count docs.deleted store.size pri.store.size
yellow open filebeat-6.2.1-2018.06.09 dihjTJw3SjGncXYln2MXbA 5 1 6 0 35.2kb 35.2kb
yellow open filebeat-6.2.1-2018.06.04 yPD91Ww0SD2ei4YI-FgLgQ 5 1 350 0 186.4kb 186.4kb
yellow open filebeat-6.2.1-2018.06.08 Qnv0gplFTgW0z1C6haZESg 5 1 97 0 89.4kb 89.4kb
Last but not least, we'll need to setup and configure kibana services to make a complete centralized management server. Just a footnote, as kibana are used to ease the process of gathering and analyzing the data through visualization, it is not an important packages like elasticSearch or logstash if you are setting up the server under a smaller box. Yet to proceed, below are the steps on installation and configuration:
 [[email protected]_master opt]# wget https://artifacts.elastic.co/downloads/kibana/kibana-6.2.1-linux-x86_64.tar.gz
--2018-06-09 13:21:41-- https://artifacts.elastic.co/downloads/kibana/kibana-6.2.1-linux-x86_64.tar.gz
Resolving artifacts.elastic.co (artifacts.elastic.co)... 107.21.237.188, 107.21.237.95, 107.21.253.15, ...
Connecting to artifacts.elastic.co (artifacts.elastic.co)|107.21.237.188|:443... connected.
HTTP request sent, awaiting response... 200 OK
Length: 83465500 (80M) [binary/octet-stream]
Saving to: ‘kibana-6.2.1-linux-x86_64.tar.gz’

100%[==============================================================================>] 83,465,500 2.76MB/s in 41s

2018-06-09 13:22:28 (1.94 MB/s) - ‘kibana-6.2.1-linux-x86_64.tar.gz’ saved [83465500/83465500]

[[email protected]_master opt]# tar -zxvf kibana-6.2.1-linux-x86_64.tar.gz
[[email protected]_master opt]# ln -s /opt/kibana-6.2.1-linux-x86_64 /opt/kibana

[[email protected]_master opt]# vi kibana/config/kibana.yml

server.host: "172.17.0.6"
server.port: 5601
elasticsearch.url: "http://172.17.0.6:9200"
Noted on above that I've link the kibana with our ElasticSearch service inside the configuration and assign a port that will be use by Kibana service once started. Now as everything are already set in place, we can startup the final services.手順は次のとおりです。
 [[email protected]_master opt]# /opt/kibana/bin/kibana --version
6.2.1

[[email protected]_master opt]# /opt/kibana/bin/kibana &
[1] 8640
[[email protected]_master opt]# log [13:26:20.034] [info][status][plugin:[email protected]] Status changed from uninitialized to green - Ready
log [13:26:20.073] [info][status][plugin:[email protected]] Status changed from uninitialized to yellow - Waiting for Elasticsearch
log [13:26:20.193] [info][status][plugin:[email protected]] Status changed from uninitialized to green - Ready
log [13:26:20.200] [info][status][plugin:[email protected]] Status changed from uninitialized to green - Ready
log [13:26:20.212] [info][status][plugin:[email protected]] Status changed from uninitialized to green - Ready
log [13:26:20.233] [info][listening] Server running at http://172.17.0.6:5601
log [13:26:20.276] [info][status][plugin:[email protected]] Status changed from yellow to green - Ready


[[email protected]_master opt]# netstat -apn|grep -i :5601
tcp 0 0 172.17.0.6:5601 0.0.0.0:* LISTEN 8640/node
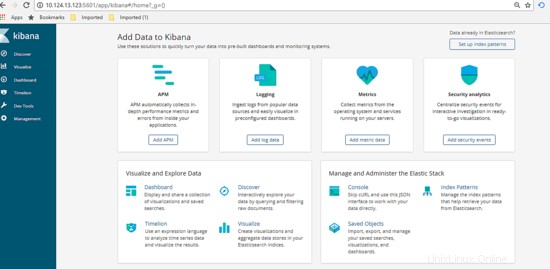
Great, now everything are up and running as per shown above using the netstat command. Now let's view the Dashboard of Kibana and made the configuration. Got to url http://172.17.0.6:5601/app , you'll see the dashboard will be shown like below.
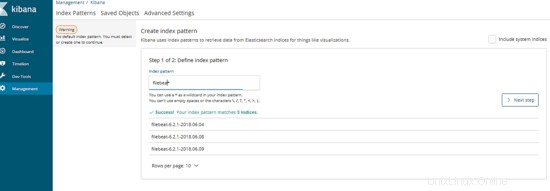
Next on the dashboard, click on Management tab then define the index pattern, for our cases the index pattern are define as our logging filename generated. Type in the information then click next.
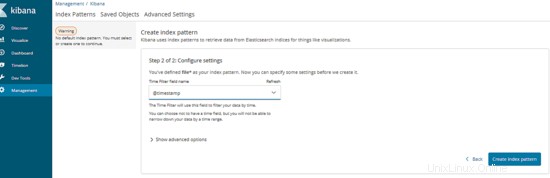
After that, type in the variables that will be use as time series. Once done, click Create Index Pattern. Below are the example:
Excellent, now the management server are ready to be use. Let's proceed by testing the usability.
4.テストフェーズ
Before we start the test, let's make the assumption for final result expections. For this test, we will try to execute a database query that will pass the long query time assign from client which is MySQL server. Once we execute, our centralized management server should automatically show the result of slow query information as graph via Kibana dashboard. Now as everything is clear, let's start the test, below are the step:
Log into any of the client server and execute the slow query SQL like below:
 [[email protected]_db1 ~]# mysql --login-path=root -P 3306 --prompt='TEST>'
Welcome to the MySQL monitor. Commands end with ; or \g.
Your MySQL connection id is 193
Server version: 5.7.21-log MySQL Community Server (GPL)

Copyright (c) 2000, 2018, Oracle and/or its affiliates. All rights reserved.

Oracle is a registered trademark of Oracle Corporation and/or its
affiliates. Other names may be trademarks of their respective
owners.

Type 'help;' or '\h' for help. Type '\c' to clear the current input statement.

TEST>select sleep(5);
+----------+
| sleep(5) |
+----------+
| 0 |
+----------+
1 row in set (5.01 sec)

TEST>select sleep(6);
+----------+
| sleep(6) |
+----------+
| 0 |
+----------+
1 row in set (6.00 sec)

TEST>select sleep(10) 'run for 10 seconds';
+--------------------+
| run for 10 seconds |
+--------------------+
| 0 |
+--------------------+
1 row in set (10.00 sec)

TEST>select sleep(3) 'test again';
+------------+
| test again |
+------------+
| 0 |
+------------+
1 row in set (3.00 sec)

TEST>exit
Bye
As shown above, we've manage to produce some of slow query that automatically jotted into each client slow query log. Now, let's go to the dashboard and see if the data information successfully been crawl by centralized server and convert it as visualization graph.
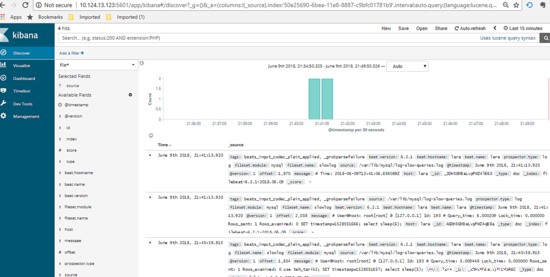
Great, as per shown above there are list of logging information succcessfully been crawl and viewed through kibana dashboard. You can use the left tab to filter what type of column you want to show or hide, below are the example :-
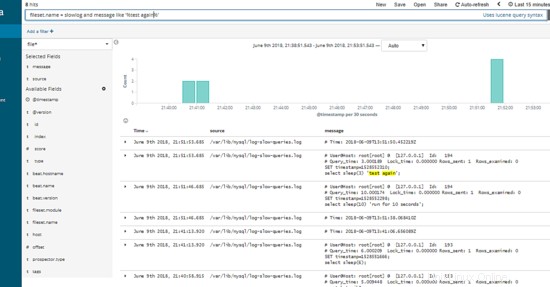
Using the textfield on top of the dashboard, you can type in SQL query related to view certain information or part of the data needed.
Excellent, as show above the slow query SQL that we've produce initially from 1 of our client server automatically shown under our Kibana Dashboard per expected.