Prometheusは、構成された任意のターゲットシステムからメトリックを収集できるオープンソースの監視システムです。 Prometheusは、強力なクエリ、優れた視覚化、正確なアラートを備えた多次元データモデルを実装し、多くの統合が付属しています。
Prometheusは元々SoundCloudによって2012年に作成されましたが、現在はオープンソースコミュニティによって独立して維持されている独立したオープンソースプロジェクトになっています。すべてのコンポーネントはGithubのApache2ライセンスの下で利用できます。
このチュートリアルでは、Prometheusとnode_exporterをインストールして構成する方法を説明します。 Prometheus監視システムをインストールしてから、サーバーからメトリックを収集するようにnode_exporterを構成します。このチュートリアルガイドでは、CentOS7サーバーを使用します。
- CentOS7サーバー
- root権限
何をしますか?
- 新しいユーザーを作成し、Prometheusをダウンロードします
- PrometheusをSystemdサービスとして構成する
- Firewallを設定する
- node_exporterのインストールと構成
- node_exporterをPrometheusサーバーに追加します
- テスト
このチュートリアルでは、Prometheusサービスはroot以外のユーザーとして実行されます。したがって、システム上に新しい非rootユーザーを作成する必要があります。 「prometheus」という名前の新しいユーザーを作成し、すべてのprometheusサービスをprometheusユーザーの下で実行します。
以下のコマンドを使用して、新しい「prometheus」ユーザーを作成します。
useradd -m -s /bin/bash prometheus
新しいユーザーが作成されました。次に、ユーザーにログインし、wgetコマンドを使用してプロメテウスをダウンロードします。
su - prometheus
wget https://github.com/prometheus/prometheus/releases/download/v2.2.1/prometheus-2.2.1.linux-amd64.tar.gz
prometheus-xx.x.x.tar.gzファイルを抽出し、ディレクトリの名前を「prometheus」に変更します。
tar -xzvf prometheus-2.2.1.linux-amd64.tar.gz
mv prometheus-2.2.1.linux-amd64/ prometheus/
Prometheusはサーバーにダウンロードされ、すべてのprometheusファイルは「/ home / prometheus/prometheus」ディレクトリにあります。
このステップでは、prometheusをsystemdサービスとして構成します。 '/ etc / systemd/system'ディレクトリに新しいサービスファイルprometheus.serviceを作成します。
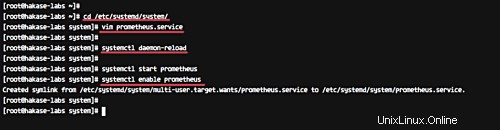
'/ etc / systemd / system /'ディレクトリに移動し、vimeditorを使用して新しいサービスファイル'prometheus.service'を作成します。
cd /etc/systemd/system/
vim prometheus.service
以下にプロメテウスサービスの設定を貼り付けます。
[Unit]
Description=Prometheus Server
Documentation=https://prometheus.io/docs/introduction/overview/
After=network-online.target

[Service]
User=prometheus
Restart=on-failure

#Change this line if you download the
#Prometheus on different path user
ExecStart=/home/prometheus/prometheus/prometheus \
  --config.file=/home/prometheus/prometheus/prometheus.yml \
  --storage.tsdb.path=/home/prometheus/prometheus/data

[Install]
WantedBy=multi-user.target
保存して終了します。
次に、以下のsystemctlコマンドを使用してsystemdシステムをリロードします。
systemctl daemon-reload
プロメテウスサービスを開始し、システムの起動時に毎回起動できるようにします。
systemctl start prometheus
systemctl enable prometheus
プロメテウスは現在systemdサービスとして実行されています。以下のコマンドを使用して確認してください。
systemctl status prometheus
「実行中」のサービスステータスを取得していることを確認してください。
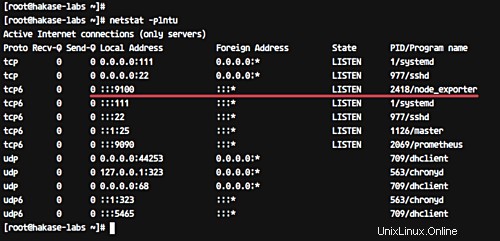
または、以下のnetstatコマンドを使用して確認してください。
netstat -plntu
以下に示す結果が得られることを確認してください。
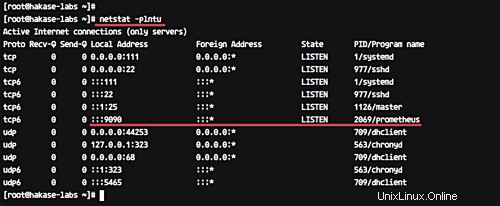
Prometheusは、デフォルトでポート「9090」で実行されています。
システムでFirewalldを使用している場合は、ポート9090をFirewalldリストポートに追加します。
以下のfirewall-cmdコマンドを使用して、Prometheusアクセス用にポート9090を開きます。
firewall-cmd --add-port=9090/tcp --permanent
firewall-cmd --reload
次に、Webブラウザを開き、ポート9090でサーバーのIPアドレスを入力します。
http://192.168.33.10:9090/graph
クエリフィールドに「http_requests_total」と入力し、[実行]ボタンをクリックします。
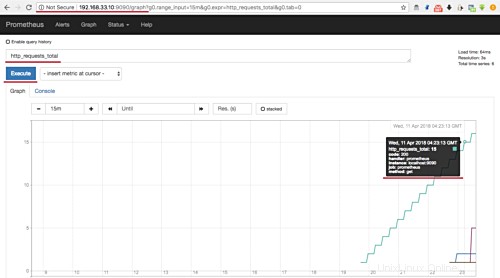
また、時間、HTTPステータスコード、メソッドなどに関するすべての情報を含む、プロメテウスサーバーへのHTTPリクエストが表示されます。
node_exporterは、*NixおよびLinuxシステムで実行できるマシンメトリックのエクスポーターです。
このチュートリアルでは、同じサーバープロメテウスにnode_exporterをインストールします。プロメテウスサーバーの指標を監視して取得します。
prometheusユーザーにログインし、wgetコマンドを使用して「node_exporter」をダウンロードします。
su - prometheus
wget https://github.com/prometheus/node_exporter/releases/download/v0.16.0-rc.1/node_exporter-0.16.0-rc.1.linux-amd64.tar.gz
node_exporterを抽出し、ディレクトリの名前を「node_exporter」に変更します。
tar -xzvf node_exporter-0.16.0-rc.1.linux-amd64.tar.gz
mv node_exporter-0.16.0-rc.1.linux-amd64 node_exporter
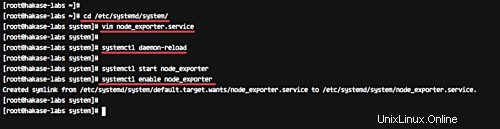
次に、node_exporterの新しいサービスファイルを作成します。ルートシェルに戻り、「/ etc / systemd / system」ディレクトリに移動し、vimを使用して新しいnode_exporterサービスファイル「node_exporter.service」を作成します。
cd /etc/systemd/system/
vim node_exporter.service
そこに、node_exporterサービス構成を下に貼り付けます。
[Unit]
Description=Node Exporter
Wants=network-online.target
After=network-online.target

[Service]
User=prometheus
ExecStart=/home/prometheus/node_exporter/node_exporter

[Install]
WantedBy=default.target
保存して終了します。
次に、systemdシステムをリロードします。
systemctl daemon-reload
次に、node_exporterサービスを開始し、システムの起動時に毎回起動できるようにします。
systemctl start node_exporter
systemctl enable node_exporter
node_exporterサービスがサーバーで実行されています。netstatコマンドを使用して確認してください。
netstat -plntu
そして、node-exporterがポート9100で実行されていることがわかります。
このステップでは、node_exporterをprometheusサーバーに追加します。 prometheusユーザーにログインし、構成'prometheus.yml'ファイルを編集します。
prometheusユーザーにログインします。
su - prometheus
'prometheus'ディレクトリに移動し、構成ファイル'prometheus.yml'を編集します。
cd prometheus/
vim prometheus.yml
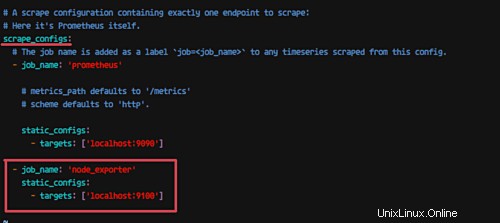
'scrape_config'行の下に、以下の構成をコピーして貼り付けて、新しいjob_namenode_exporterを追加します。
  - job_name: 'node_exporter'
    static_configs:
      - targets: ['localhost:9100']
保存して終了します。
次に、プロメテウスサービスを再起動します。
systemctl restart prometheus
node_exporterがprometheusサーバーに追加されました。
Webブラウザを開き、サーバーのIPアドレスを入力します。
http://192.168.33.10:9090/
meminfoコレクターを入力します' node_memory_MemAvailable_bytes クエリフィールドに「」を入力し、「実行」ボタンをクリックします。
そして、以下のような結果が得られます。
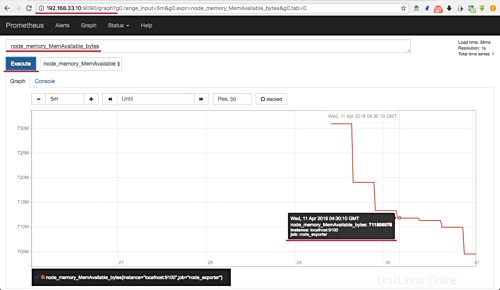
サーバーインスタンス「localhost:9100」およびjob_name「node-exporter」で使用可能なメモリを取得します。
または、node_exporterの生データにアクセスする場合は、node_exporterポート9100をfirewalldに追加する必要があります。
firewall-cmd --add-port=9100/tcp
firewall-cmd --reload
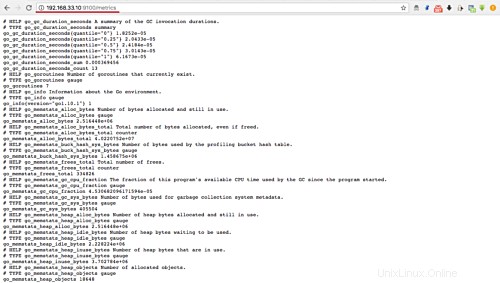
次に、ポート9100でサーバーのIPアドレスを入力します。
http://192.168.33.10:9100/metrics
そして、以下に示すようにnode_exporter生データを取得します。
CentOS7でのnode_exporterを使用したプロメテウス監視システムのインストールと構成が正常に完了しました。