通常、「稼働時間」を使用します Linuxシステムまたはサーバーが実行されている時間を検索するコマンド。 uptimeコマンドは、現在の時刻、システムの実行時間、現在ログオンしているユーザーの数、過去1、5、および15分間のシステム負荷の平均などの詳細を取得します。今日、私は Tuptimeという名前の同様のユーティリティに出くわしました 、uptimeコマンドの代替。 Tuptimeは、 Pythonで記述されたコマンドラインユーティリティです。 これは、Linuxシステムの履歴と統計のリアルタイムを報告し、再起動の合間に保持します。稼働時間と同じですが、より興味深い出力が表示されます。このガイドでは、Tuptimeユーティリティを使用してLinuxシステムの稼働時間を見つける方法を説明します。
先に進む前に、「uptime」コマンドを使用してシステムの稼働時間を見つけるためのいくつかの例を示します。
引数なしでuptimeコマンドを実行した場合;
$ uptime
以下のような出力が表示されます。
09:53:21 up 18 min, 1 user, load average: 0.01, 0.03, 0.06
ここで
- 09:53:21 -現在の時刻
- 最大18分 -合計稼働時間
- 1ユーザー -現在ログインしているユーザーの数
- 平均負荷:0.01、0.03、0.06 -過去5、10、15分間の平均システム負荷。
合計稼働時間のみを表示するには、次のコマンドを実行します:
$ uptime -p
または、
$ uptime --pretty
システムが起動した日時を表示するには、次のコマンドを実行します。
$ uptime --s
または、
$ uptime --since
ご覧のとおり、稼働時間には2つのオプションしかありません(ただし、これで十分です)。
Uptimeコマンドと比較すると、Tuptimeユーティリティには次の追加の詳細が表示されます。
- tuptimeユーティリティをインストールした日からの合計システム稼働時間
- システムの起動とシャットダウンの総数
- 正しくまたは誤って実行されたシャットダウンの総数
- システムの稼働時間とダウンタイムの時間カウンター(パーセンテージ)
- 最大/最短/平均稼働時間
- 最大/最短/平均ダウンタイム
- 現在の稼働時間。
Tuptimeのインストール
TuptimeはAURで利用できます 、したがって、以下のようなAURヘルパーを使用してArchLinuxとそのバリアントにインストールできます。
$ yay -S tuptime
Debian、Ubuntu、Linux Mintの場合:
$ sudo apt-get install tuptime
[ユニバース]が有効になっていることを確認してください tuptimeをインストールするためのUbuntuとその派生物のリポジトリ。
コマンドを使用してユニバースを有効にできます:
$ sudo add-apt-repository universe
他のLinuxディストリビューションでは、次のコマンドを使用してGitがTuptimeリポジトリのクローンを作成します。
$ git clone https://github.com/rfrail3/tuptime.git
「tuptime」バイナリファイルを$PATHにコピーします(例: "/ usr / local / bin /" )。 :
$ sudo cp tuptime/src/tuptime /usr/local/bin/tuptime
最後に、実行可能にします:
$ sudo chmod ugo+x /usr/local/bin/tuptime
Tuptimeを使用してLinuxシステムの稼働時間の詳細を検索する
Linuxシステムの稼働時間の詳細を表示するには、次のコマンドを実行するだけです。
$ tuptime
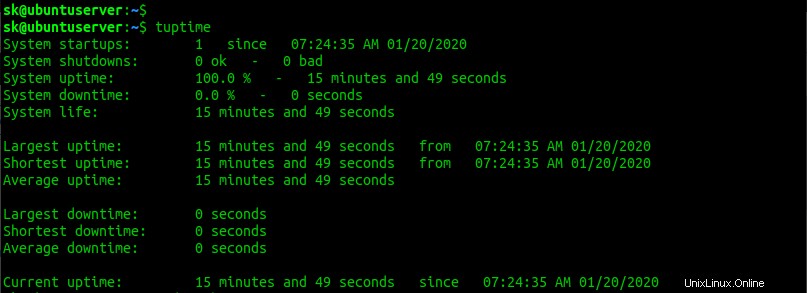
出力例:
System startups: 1 since 07:24:35 AM 01/20/2020
System shutdowns: 0 ok - 0 bad
System uptime: 100.0 % - 15 minutes and 49 seconds
System downtime: 0.0 % - 0 seconds
System life: 15 minutes and 49 seconds

Largest uptime: 15 minutes and 49 seconds from 07:24:35 AM 01/20/2020
Shortest uptime: 15 minutes and 49 seconds from 07:24:35 AM 01/20/2020
Average uptime: 15 minutes and 49 seconds

Largest downtime: 0 seconds
Shortest downtime: 0 seconds
Average downtime: 0 seconds

Current uptime: 15 minutes and 49 seconds since 07:24:35 AM 01/20/2020
従来のUptimeコマンドとは異なり、Tuptimeは、インストールされた日からシステムの再起動とシャットダウンを追跡します。今日、私はそれをUbuntuサーバーにインストールし、システムを2回再起動しました。 Tuptimeは、すべてのシステムの起動/シャットダウンを追跡し、その情報をわかりやすい方法で提示しました。
次の出力をご覧ください。
$ tuptime
System startups: 3 since 07:24:35 AM 01/20/2020
System shutdowns: 2 ok <- 0 bad
System uptime: 43.18 % - 1 hour, 0 minutes and 27 seconds
System downtime: 56.82 % - 1 hour, 19 minutes and 32 seconds
System life: 2 hours, 19 minutes and 59 seconds

Largest uptime: 35 minutes and 1 second from 07:41:00 AM 01/20/2020
Shortest uptime: 9 minutes and 20 seconds from 09:35:14 AM 01/20/2020
Average uptime: 20 minutes and 9 seconds

Largest downtime: 1 hour, 19 minutes and 13 seconds from 08:16:01 AM 01/20/2020
Shortest downtime: 19 seconds from 07:40:41 AM 01/20/2020
Average downtime: 39 minutes and 46 seconds

Current uptime: 9 minutes and 20 seconds since 09:35:14 AM 01/20/2020
見る?システムの起動とシャットダウンのカウント、合計稼働時間/ダウンタイムの平均稼働時間/ダウンタイムの詳細は、それに応じて更新されます。デフォルトのuptimeコマンドは、そのような詳細を追跡しません。
Tuptimeオプション
Tuptimeには、出力を自由にフォーマットするための便利なオプションがいくつか付属しています。
出力を表列ビューで表示
tabular-columnにシステムの稼働時間を表示するには フォーマットするには、 -tを使用します フラグ。
$ tuptime -t
No.             Startup Date                               Uptime            Shutdown Date   End                            Downtime

1     07:24:35 AM 01/20/2020             16 minutes and 6 seconds   07:40:41 AM 01/20/2020    OK                          19 seconds
2     07:41:00 AM 01/20/2020              35 minutes and 1 second   08:16:01 AM 01/20/2020    OK   1 hour, 19 minutes and 13 seconds
3     09:35:14 AM 01/20/2020   2 hours, 57 minutes and 58 seconds
リストビュー
同様に、出力をリストビューとして表示できます。 -lを使用 フラグ。
$ tuptime -l
Startup:  1  at  07:24:35 AM 01/20/2020
Uptime:   16 minutes and 6 seconds
Shutdown: OK  at  07:40:41 AM 01/20/2020
Downtime: 19 seconds

Startup:  2  at  07:41:00 AM 01/20/2020
Uptime:   35 minutes and 1 second
Shutdown: OK  at  08:16:01 AM 01/20/2020
Downtime: 1 hour, 19 minutes and 13 seconds

Startup:  3  at  09:35:14 AM 01/20/2020
Uptime:   3 hours, 0 minutes and 42 seconds
カーネルの詳細を追加
カーネル情報を追加することもできます -kを使用した出力 フラグ。
$ tuptime -k
System startups:	3   since   07:24:35 AM 01/20/2020
System shutdowns:	2 ok   <-   0 bad
System uptime: 		74.54 %   -   3 hours, 52 minutes and 54 seconds
System downtime: 	25.46 %   -   1 hour, 19 minutes and 32 seconds
System life: 		5 hours, 12 minutes and 26 seconds
System kernels: 	1

Largest uptime: 	3 hours, 1 minute and 47 seconds   from   09:35:14 AM 01/20/2020
...with kernel: 	Linux-4.15.0-74-generic-x86_64-with-Ubuntu-18.04-bionic
Shortest uptime:	16 minutes and 6 seconds   from   07:24:35 AM 01/20/2020
...with kernel: 	Linux-4.15.0-74-generic-x86_64-with-Ubuntu-18.04-bionic
Average uptime: 	1 hour, 17 minutes and 38 seconds

Largest downtime:	1 hour, 19 minutes and 13 seconds   from   08:16:01 AM 01/20/2020
...with kernel: 	Linux-4.15.0-74-generic-x86_64-with-Ubuntu-18.04-bionic
Shortest downtime:	19 seconds   from   07:40:41 AM 01/20/2020
...with kernel: 	Linux-4.15.0-74-generic-x86_64-with-Ubuntu-18.04-bionic
Average downtime: 	39 minutes and 46 seconds

Current uptime: 	3 hours, 1 minute and 47 seconds   since   09:35:14 AM 01/20/2020
...with kernel: 	Linux-4.15.0-74-generic-x86_64-with-Ubuntu-18.04-bionic
日付スタイルの変更
人間が読める形式のデフォルトの日付スタイルと秒単位の印刷時間を変更することもできます。 およびエポックの日付 。
これを行うには、 -sを使用します フラグ。
$ tuptime -s
System startups:	3   since   1579505075
System shutdowns:	2 ok   <-   0 bad
System uptime: 		74.77 %   -   14140.49
System downtime: 	25.23 %   -   4772.32
System life: 		18912.81

Largest uptime: 	11073.81   from   1579512914
Shortest uptime:	965.97   from   1579505075
Average uptime: 	4713.5

Largest downtime:	4753.29   from   1579508161
Shortest downtime:	19.03   from   1579506041
Average downtime: 	2386.16

Current uptime: 	11073.81   since   1579512914
日付形式の変更
デフォルトでは、Tuptimeはシステムロケールに基づいて詳細を出力します。ただし、日付形式を変更することはできます -dを使用して好みに応じて 以下のようなフラグ。
$ tuptime -d '%H:%M:%S %m-%d-%Y'
System startups:	3   since   07:24:35 01-20-2020
System shutdowns:	2 ok   <-   0 bad
System uptime: 		74.89 %   -   3 hours, 57 minutes and 15 seconds
System downtime: 	25.11 %   -   1 hour, 19 minutes and 32 seconds
System life: 		5 hours, 16 minutes and 47 seconds

Largest uptime: 	3 hours, 6 minutes and 8 seconds   from   09:35:14 01-20-2020
Shortest uptime:	16 minutes and 6 seconds   from   07:24:35 01-20-2020
Average uptime: 	1 hour, 19 minutes and 5 seconds

Largest downtime:	1 hour, 19 minutes and 13 seconds   from   08:16:01 01-20-2020
Shortest downtime:	19 seconds   from   07:40:41 01-20-2020
Average downtime: 	39 minutes and 46 seconds
出力をCSV形式で表示
必要に応じて、CSV形式で出力を印刷することもできます。
$ tuptime --csv
"System startups","3","since","07:24:35 AM 01/20/2020"
"System shutdowns","2","ok","<-","0","bad"
"System uptime","75.2 %","-","4 hours, 1 minute and 10 seconds"
"System downtime","24.8 %","-","1 hour, 19 minutes and 32 seconds"
"System life","5 hours, 20 minutes and 43 seconds"
"Largest uptime","3 hours, 10 minutes and 4 seconds","from","09:35:14 AM 01/20/2020"
"Shortest uptime","16 minutes and 6 seconds","from","07:24:35 AM 01/20/2020"
"Average uptime","1 hour, 20 minutes and 23 seconds"
"Largest downtime","1 hour, 19 minutes and 13 seconds","from","08:16:01 AM 01/20/2020"
"Shortest downtime","19 seconds","from","07:40:41 AM 01/20/2020"
"Average downtime","39 minutes and 46 seconds"
"Current uptime","3 hours, 10 minutes and 4 seconds","since","09:35:14 AM 01/20/2020"
>
1年前からの出力を表示
システムを何年も稼働させたままにしておくと、このオプションを使用すると、1年前からLinuxシステムの稼働時間を増やすことができます。
$ tuptime --tsince -31557600
詳細については、マニュアルページを参照してください。
$ man uptime
$ man tuptime
推奨される読み物:
- Uptimedを使用してLinuxシステムの稼働時間を監視する方法
- Linuxで複数のホストをすばやく監視する方法
- Linuxでプロセスが実行されている期間を確認する方法