プロメテウス は、オープンソースの監視、クエリ、およびアラートツールです。もともとSoundcloudによって2012年に構築された機能豊富なツールは、ITインフラストラクチャを監視し、すべてのシステムがスムーズに実行されていることを確認するために、いくつかの企業に採用されています。 Prometheusを使用すると、HTTPプロトコルを介してCPUやメモリの使用率などの時系列メトリックをクエリおよびプルできます。 リアルタイムグラフでそれらを視覚化します。また、ノードまたはサービスのダウンタイムが発生した場合にアラートをプッシュするようにPrometheusを構成し、 Grafanaなどの他のサードパーティの監視ツールと統合することもできます。 データの視覚化を強化します。このガイドでは、CentOS 8 /RHEL8システムへのPrometheusのインストールについて説明します。
ステップ1)Prometheusユーザーとグループの作成
まず、Prometheusのシステムユーザーを作成します。これを実現するには、以下のコマンドを実行してください。
[[email protected] ~]# useradd -m -s /bin/false prometheus
[[email protected] ~]# id prometheus
uid=1002(prometheus) gid=1002(prometheus) groups=1002(prometheus)
[[email protected] ~]#
お気づきかもしれませんが、システムユーザーには/ bin/falseオプションで指定されたログイン権限がありません
ステップ2)Prometheusの構成ディレクトリを作成する
Prometheusのユーザーが作成されたら、Prometheus構成ファイルとデータを格納する/etcおよび/varディレクトリに構成ディレクトリを作成します。したがって、以下のコマンドを実行します。
[[email protected] ~]# mkdir /etc/prometheus
[[email protected] ~]# mkdir /var/lib/prometheus
/ var / lib / prometheus
に所有権を設定します[[email protected] ~]# chown prometheus /var/lib/prometheus/
ステップ3)Prometheustarファイルのダウンロード
ディレクトリが配置されたら、Prometheusをダウンロードできます。最新バージョンを入手するには、ダウンロードページにアクセスして、ご使用の環境の最新バージョンを入手してください。この記事を執筆した時点では、最新バージョンはv2.14.0でした。または、以下のコマンドを実行するだけです
[[email protected] ~]# dnf install wget -y
[[email protected] ~]# wget https://github.com/prometheus/prometheus/releases/download/v2.14.0/prometheus-2.14.0.linux-amd64.tar.gz -P /tmp
ダウンロードが完了したら、図のようにtarballファイルを抽出します
[[email protected] tmp]# tar -zxpvf prometheus-2.14.0.linux-amd64.tar.gz
これにより、prometheus-2.14.0.linux-amd64
というディレクトリが残ります。ツリーコマンドを使用してディレクトリ構造を表示します
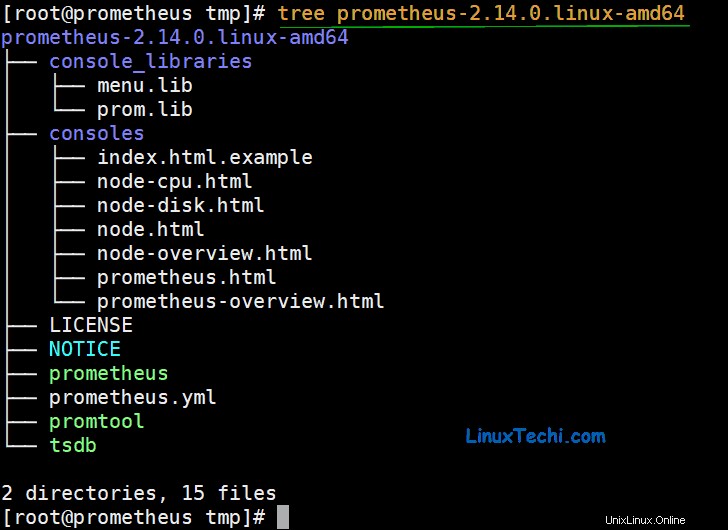
抽出されたディレクトリには、prometheusとpromtoolの2つのバイナリファイルが含まれており、/ usr / local/binパスにコピーする必要があります。
したがって、抽出されたディレクトリに移動し、次のコマンドを使用してそれらをコピーします。
[[email protected] ~]# cd /tmp/prometheus-2.14.0.linux-amd64
[[email protected] prometheus-2.14.0.linux-amd64]# cp prometheus  /usr/local/bin
他のバイナリファイルについても同様に行います
[[email protected] prometheus-2.14.0.linux-amd64]# cp promtool /usr/local/bin
ステップ4)Prometheusの構成ファイルを作成する
構成を開始するには、ファイル/etc/prometheus/prometheus.ymlを作成し、ファイルに構成を貼り付けます
[[email protected] ~]# vi /etc/prometheus/prometheus.yml
# Global config
global:
  scrape_interval:     15s # Set the scrape interval to every 15 seconds. Default is every 1 minute.
  evaluation_interval: 15s # Evaluate rules every 15 seconds. The default is every 1 minute.
  scrape_timeout: 15s  # scrape_timeout is set to the global default (10s).
# A scrape configuration containing exactly one endpoint to scrape:# Here it's Prometheus itself.
scrape_configs:
  # The job name is added as a label `job=<job_name>` to any timeseries scraped from this config.
  - job_name: 'prometheus'
    # metrics_path defaults to '/metrics'
    # scheme defaults to 'http'.
    static_configs:
    - targets: ['localhost:9090']
これは、ローカルシステム(Prometheusサーバー)のみを監視します。
次に、ファイアウォールを次のように調整して、ポート9090を介したサーバーへの外部接続を許可します
[[email protected] ~]# firewall-cmd --add-port=9090/tcp --permanent
success
[[email protected] ~]# firewall-cmd --reload
success
[[email protected] ~]#
ステップ5)PrometheusServer用のSystemdサービスファイルを作成する
systemdを使用してPrometheusをサービスとして管理するには、そのためのシステムファイルを作成する必要があります。したがって、図のようにファイルを作成し、コンテンツを貼り付けます。
[[email protected] ~]# vi /etc/systemd/system/prometheus.service
[Unit]
Description=Prometheus Time Series Collection and Processing Server
Wants=network-online.target
After=network-online.target

[Service]
User=prometheus
Group=prometheus
Type=simple
ExecStart=/usr/local/bin/prometheus \
    --config.file /etc/prometheus/prometheus.yml \
    --storage.tsdb.path /var/lib/prometheus/ \
    --web.console.templates=/etc/prometheus/consoles \
    --web.console.libraries=/etc/prometheus/console_libraries

[Install]
WantedBy=multi-user.target
変更を有効にするには、systemctlをリロードします。
[[email protected] ~]# systemctl daemon-reload
次に、Prometheusを起動して有効にし、起動時に実行できるようにします
[[email protected] ~]# systemctl start prometheus
[[email protected] ~]# systemctl enable prometheus
Prometheusが実行されていることを確認するには、次のコマンドを実行します。
[[email protected] ~]# systemctl status prometheus
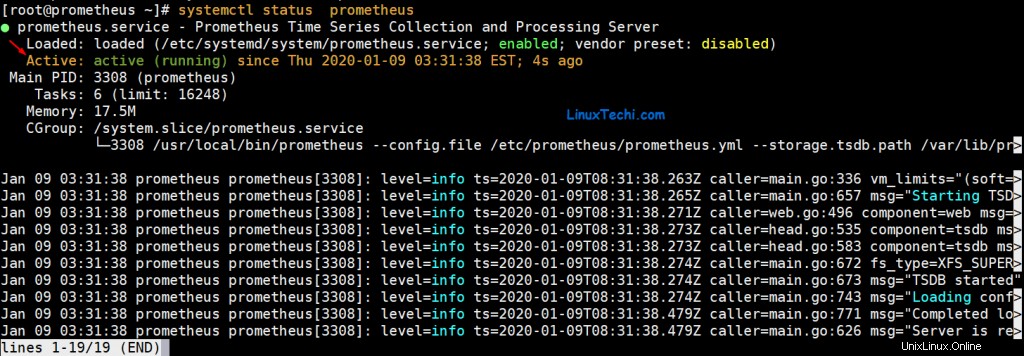
表示された出力から、Prometheusがエラーなしで期待どおりに実行されていることがはっきりとわかります。また、netstatユーティリティを使用して、サービスがポート9090でリッスンしているかどうかを確認できます。
[[email protected] ~]# netstat -tunlp
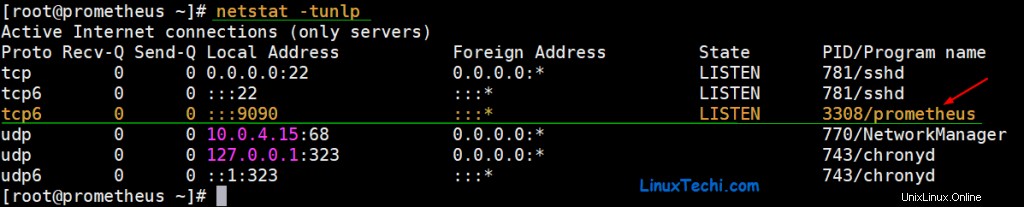
それは素晴らしいことです! Prometheusは期待どおりポート9090で実行されています。次に、示されているようにサーバーのIPを参照しながら、ブラウザに移動します
http:// server-ip:9090
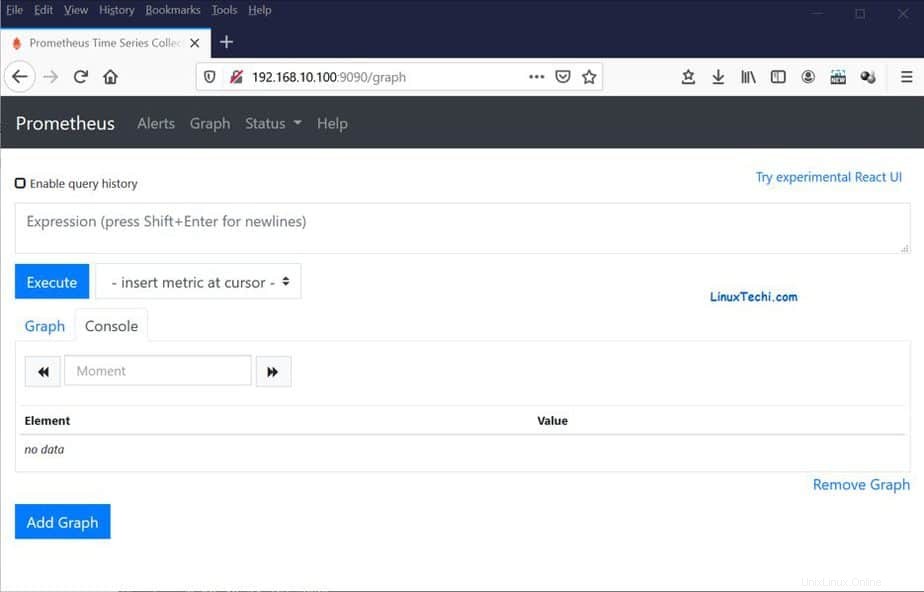
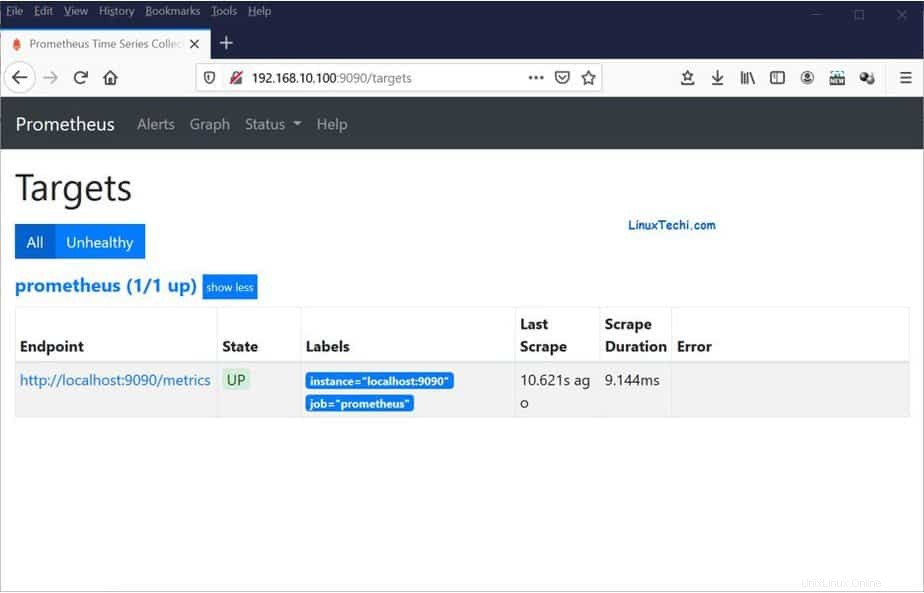
[ステータス]をクリックします 」タブをクリックし、「ターゲット」をクリックします ’
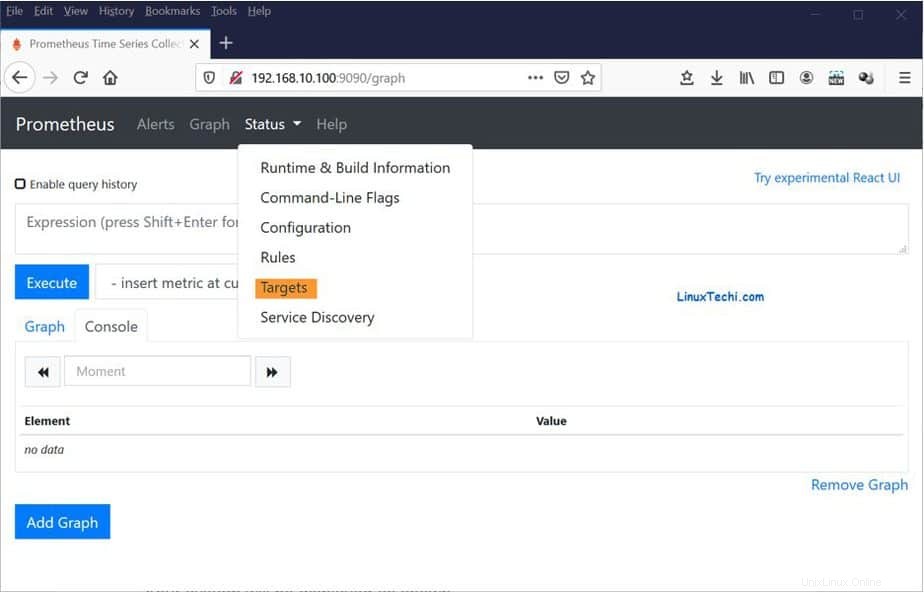
システムは次のように表示されます
ステップ6)node_exporterをインストールして構成します
ノードエクスポータ は、CPU、メモリ使用量、ファイルシステム、ネットワーク統計など、膨大な数のLinuxシステムメトリックを収集して送信するユーティリティです。このセクションでは、node_exporterをPrometheusサーバーとリモートのCentOS 8 Linuxホストにインストールし、2つのホストのシステムメトリックを監視します。
Prometheusノードで、node_exporterのシステムユーザーを作成します。
[[email protected] ~]# useradd -m -s /bin/false node_exporter
次に、Prometheusのダウンロードページに移動し、node_exporter tarballをダウンロードするか、以下のwgetを使用してコマンドラインからダウンロードします。
[[email protected] ~]# wget https://github.com/prometheus/node_exporter/releases/download/v0.18.1/node_exporter-0.18.1.linux-amd64.tar.gz
node_exporterファイルをダウンロードしたら、次のように続行して解凍します
[[email protected] ~]# tar -zxpvf node_exporter-0.18.1.linux-amd64.tar.gz
図のようにtreeコマンドを使用して、抽出したフォルダの内容を確認できます
[[email protected] ~]# tree node_exporter-0.18.1.linux-amd64
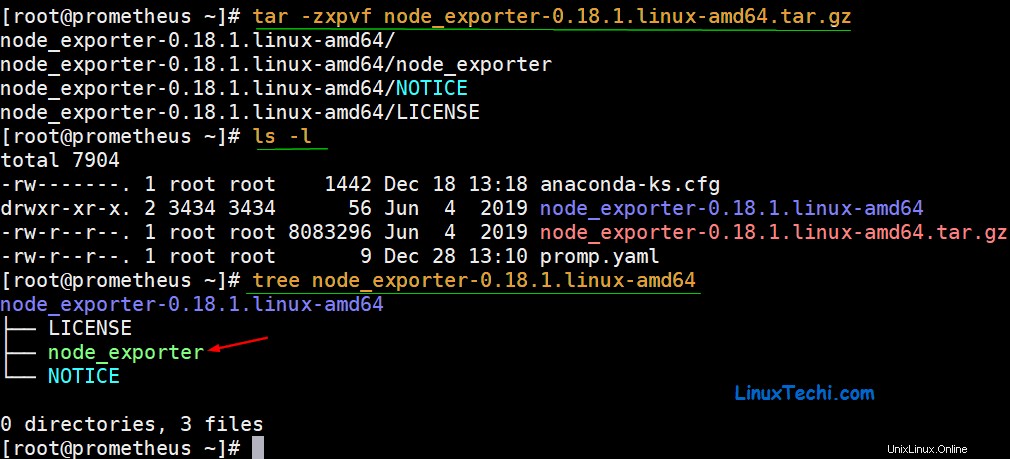
次に、 node_exporterというバイナリファイルをコピーします / usr / local/binパスへ
[[email protected] ~]# cp node_exporter-0.18.1.linux-amd64/node_exporter /usr/local/bin
次に、図のようにコピーされたnode_exporterファイルのファイル権限を設定します
[[email protected] ~]# chown node_exporter:node_exporter /usr/local/bin/node_exporter
次に、サービスとして実行するようにnode_exporterを構成する必要があります。したがって、次に進み、図のようにsystemdサービスファイルを作成します
[[email protected] ~]# vi /etc/systemd/system/node_exporter.service
次に、以下に示す構成を貼り付けて、ファイルを保存します
[Unit]
Description=Prometheus Node Exporter
Wants=network-online.target
After=network-online.target

[Service]
User=node_exporter
Group=node_exporter
Type=simple
ExecStart=/usr/local/bin/node_exporter

[Install]
WantedBy=multi-user.target
変更を有効にするには、次のコマンドを使用してsystemdmanagerをリロードします。
[[email protected] ~]# systemctl daemon-reload
次に、node_exporterサービスを開始して有効にします
[[email protected] ~]# systemctl start node_exporter
[[email protected] ~]# systemctl enable node_exporter
サービスが実行されていることを確認するために、次を実行します。
[[email protected] ~]# systemctl status node_exporter
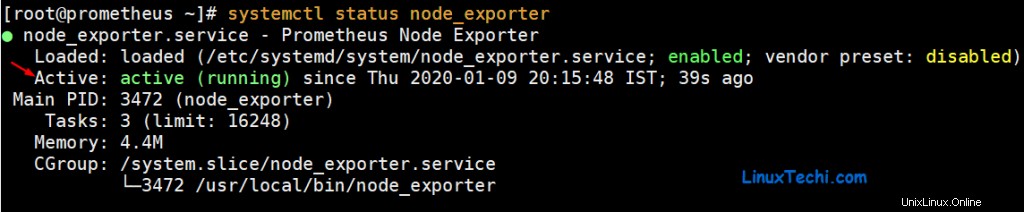
サービスが実行されていることを確認するために、netstatユーティリティを使用して、デフォルトで期待されているようにポート9100でリッスンしているかどうかを確認します。
[[email protected] ~]# netstat -pnltu | grep 9100
tcp6       0      0 :::9100       :::*          LISTEN      3472/node_exporter
[[email protected] ~]#
完全! Node_exporterサービスは期待どおりに実行されています。
次に、図のようにファイアウォールでポート9100を開きます
[[email protected] ~]# firewall-cmd --add-port=9100/tcp  --permanent
success
[[email protected] ~]# firewall-cmd --reload
success
[[email protected] ~]#
リモートCentOS8Linuxシステムについても概説した手順を繰り返します。
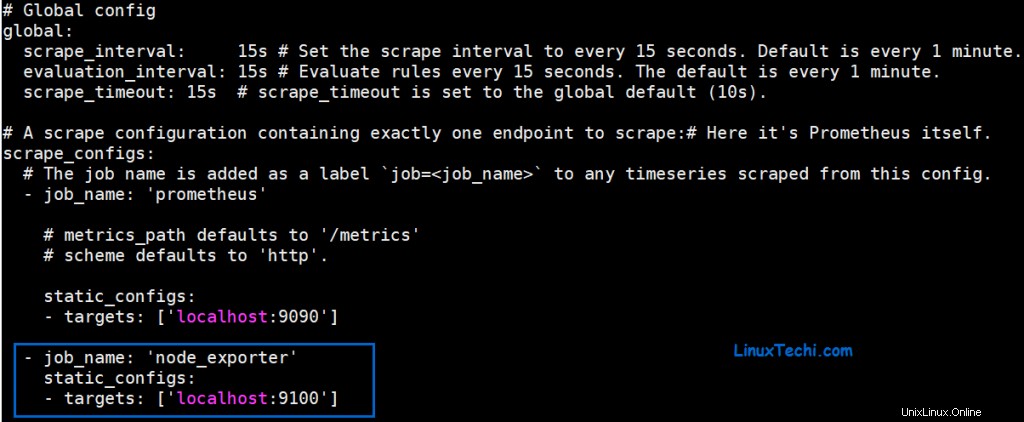
最後に、node_exporterターゲットをprometheus.ymlファイルに追加する必要があります。以下の行を追加して、Prometheusサーバーのnode_exporterを定義します
[[email protected] ~]# vi /etc/prometheus/prometheus.yml
---------
 - job_name: 'node_exporter'
   static_configs:
   - targets: ['localhost:9100']
>
Prometheusサービスを再起動します
[[email protected] ~]# systemctl restart prometheus
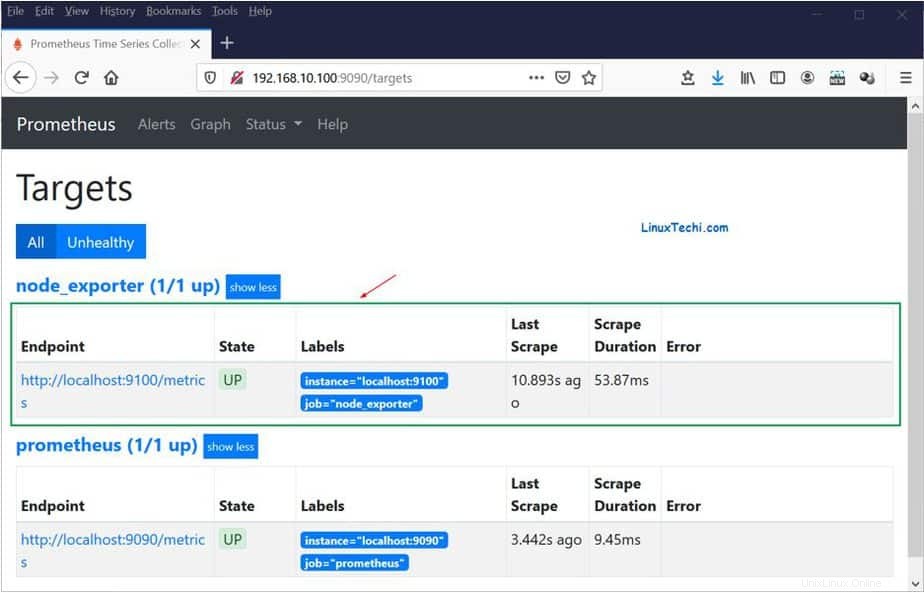
もう一度、ブラウザに移動して、[ステータス]をクリックします 」タブをクリックし、「ターゲット」をクリックします ’
ブラウザでnode_exporterという新しいエンドポイントを確認してください。 Prometheusサーバー用
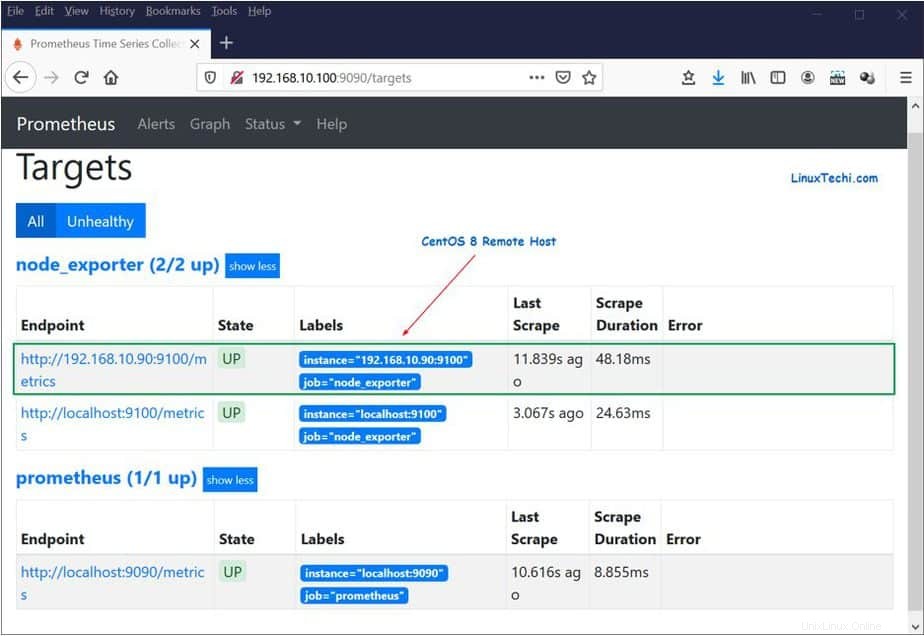
リモートLinuxシステムのエンドポイントを追加するには prometheus.ymlに戻ります ファイルを作成し、以下の行を追加します
–ターゲット:[‘192.168.10.90:9100’]
node_exporterセクションは次のようになります
 - job_name: 'node_exporter'
   static_configs:
   - targets: ['localhost:9100']
   - targets: ['192.168.10.90:9100']
変更を保存して、Prometheusサービスを再起動します
[[email protected] ~]# systemctl restart prometheus
ブラウザを更新して、リモートのCentOSLinuxシステムに追加された2番目のエンドポイントに注目してください。
構成されたノードからメトリックを確実に受信するため。次のようにcurlコマンドを使用するだけです。
#curl http:// node-ip:9100 /metrics
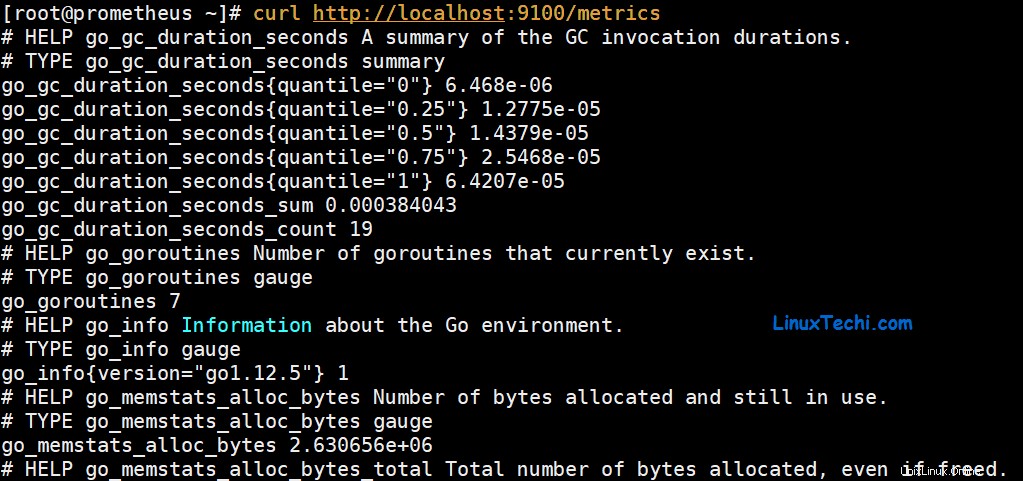
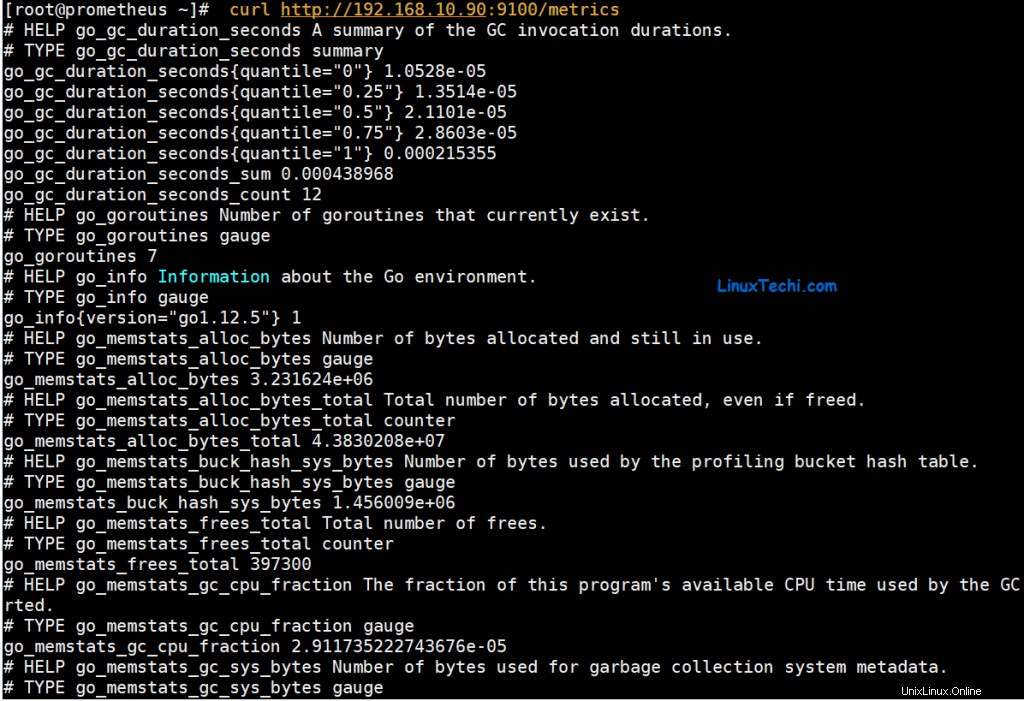
たとえば、Prometheusサーバーからのメトリックを表示するには、次のコマンドを実行します。
[[email protected] ~]# curl http://localhost:9100/metrics
リモートCentOS8ホストの場合、次のコマンドを実行しました:
[[email protected] ~]# curl http://192.168.10.90:9100/metrics
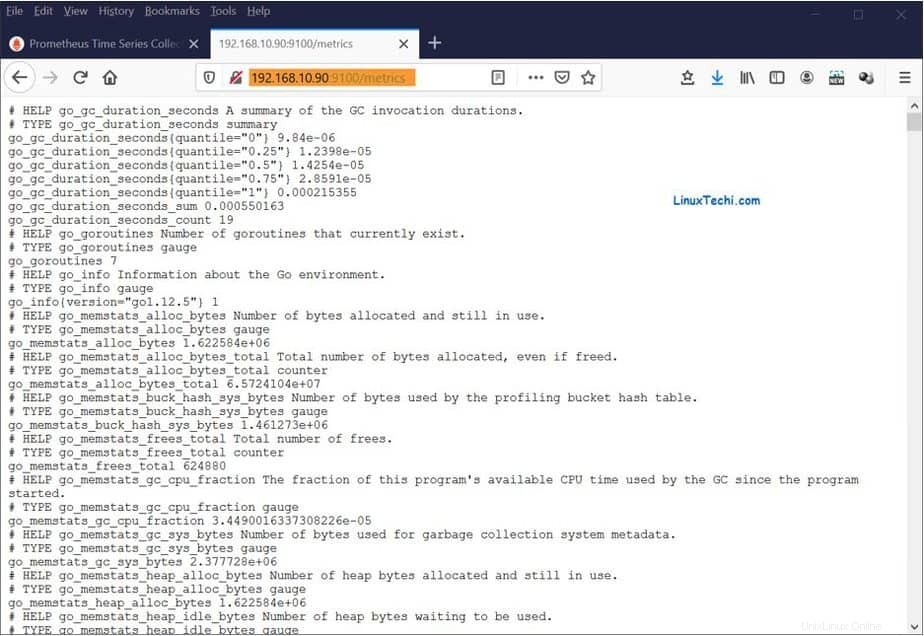
これは、ブラウザを開いてURLを参照することでも実現できます
http://192.168.10.90:9100/metrics
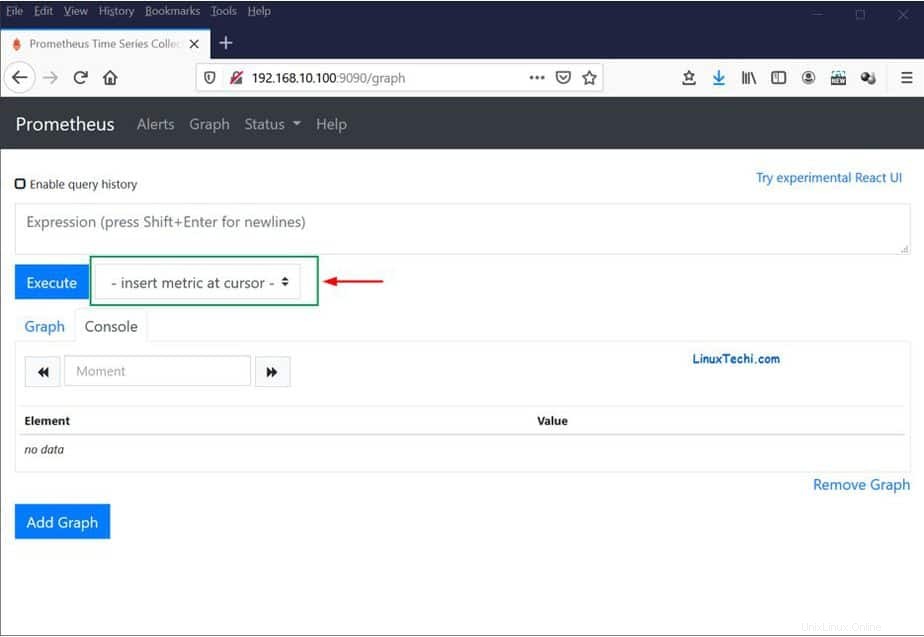
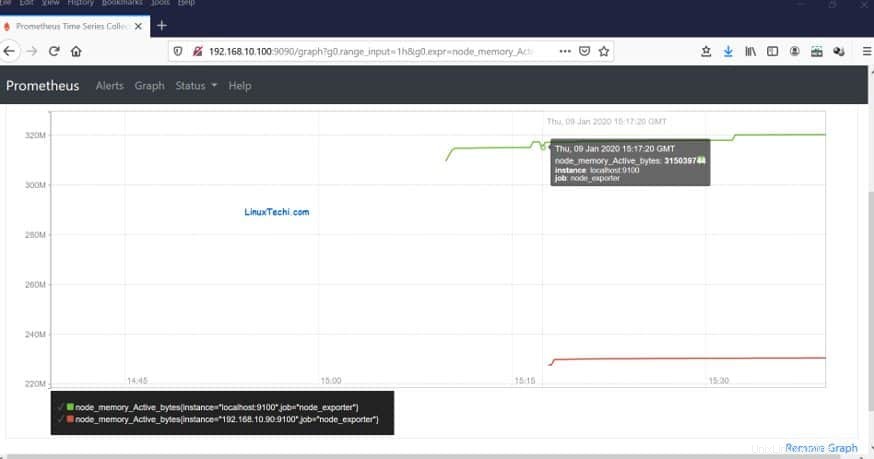
必要なメトリックをグラフ化することもできます。 Prometheusサーバーのホームページに移動し、[カーソルにメトリックを挿入]というラベルの付いたドロップダウンメニューをクリックするだけです。 ’。
グラフ化する指標を選択します
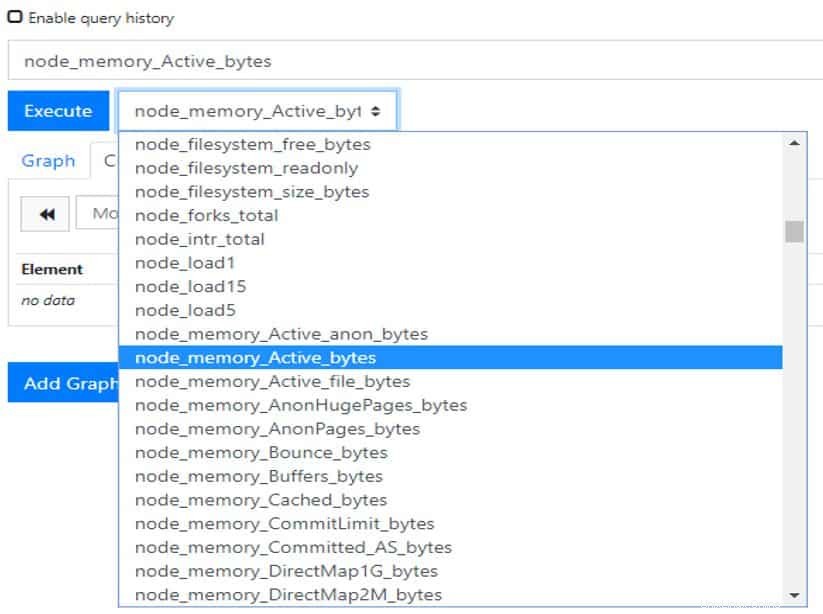
[実行]をクリックします 」ボタンをクリックし、「グラフ」をクリックします グラフを表示するには、すぐ下の’タブ
そして、これでこのトピックは終わりです。これで、サーバーとリモートホストの両方でシステムメトリックを監視するようにPrometheusが正常にインストールおよび構成されました。次のガイドでは、PrometheusをGrafanaと統合して、メトリックの視覚化と分析を改善します。フィードバックをお気軽に共有し、記事を友人と共有してください。